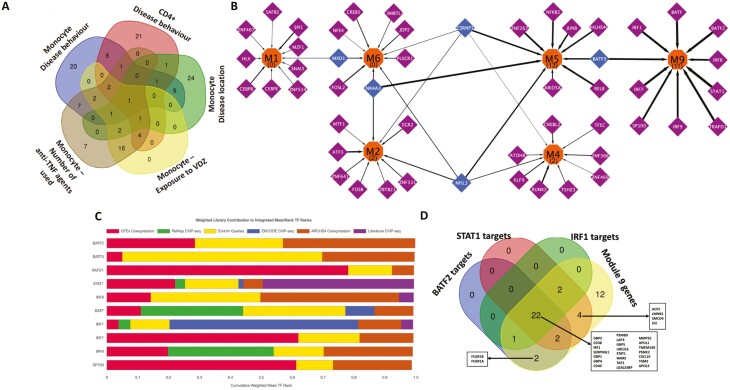
FIGURE 6.
A, Overlap of the transcription factors inferred for the active modules derived from gene expression in monocytes and CD4+ cells for the associated phenotypes. B, Transcriptional regulatory network showing the TFs modulating the expression of the monocyte modules active with respect to the disease behavior phenotype. Orange nodes represent the modules, purple nodes the TFs exclusively regulating the modules, and blue nodes the TFs regulating more than one module. The numbers within parentheses inside the orange nodes represent the number of Reactome signaling pathways enriched (FDR ≤ 0.05) within the genes found in the module. The thickness of the edges denote the percentage of genes of the module which are regulated by the TF. The figure indicates that the functionally distinct modules (as shown earlier by the set of Reactome pathways uniquely overrepresented in each of them) also have mostly distinct regulatory control, with very few transcription factors controlling the multiple modules. Visualization was performed using Cytoscape.90 C, Bar chart displaying the integrated mean ranks (from across orthogonal TF-target libraries) of the top 10 TFs for the genes in module 9 (enriched in interferon-gamma related pathways) derived from monocyte gene expression and active with respect to the disease behavioral phenotype. D, The distribution profile of genes in module 9 as targets of the most relevant TFs identified.

