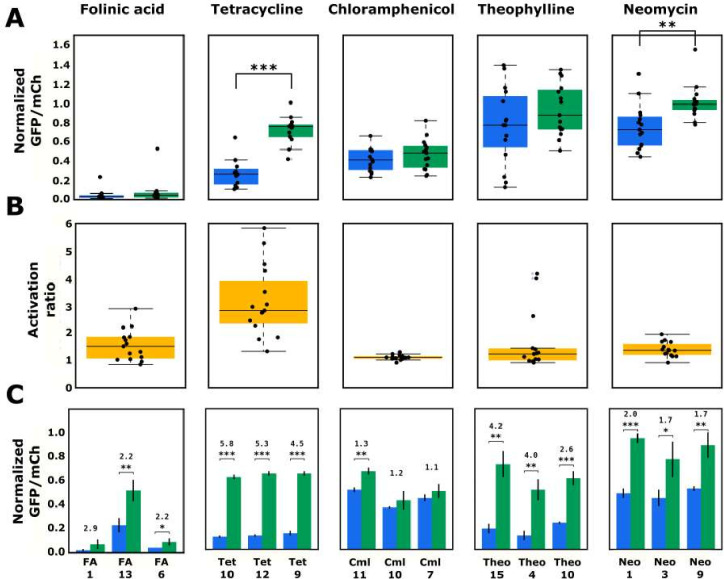
Figure 6. Validated basal and activated gene-regulatory activities for the top-performing ribozyme sequences predicted from the convolutional neural network model.
(A) The basal and activated gene-regulatory activities for the top 15 predicted ribozyme sequences characterized individually via flow cytometry analysis. The box plots show the middle two quartiles of the gene-regulatory activities of ribozymes in the absence (blue) and presence (green) of the indicated ligand, with the mean activity levels for clonal populations of the individual ribozymes represented by the black points. The whiskers extending from the boxes represent 1.5 times the interquartile range, which approximates 99% of the expected range for values. Both basal and activated activity levels are normalized to that of an inactive ribozyme control (sTRSVc). (B) The activation ratio values (ratio of activity levels in the presence and absence of the indicated ligand) for the top 15 ribozyme sequences. The box plot represents the middle two quartiles for activation ratio, with the activation ratios for individual sequences represented by the black points. (C) The basal and activated gene-regulatory activities and the activation ratio values for the three best performing designs among the top 15 predicted designs. The blue and green bars represent the mean basal and induced gene-regulatory activities, respectively, for an individual ribozyme sequence, with the error bars showing the standard deviation. The number above each pair of bars represents the activation ratio for that sequence. p-values < 0.05 are represented by *, those <0.01 by **, and those <0.001 by ***.

