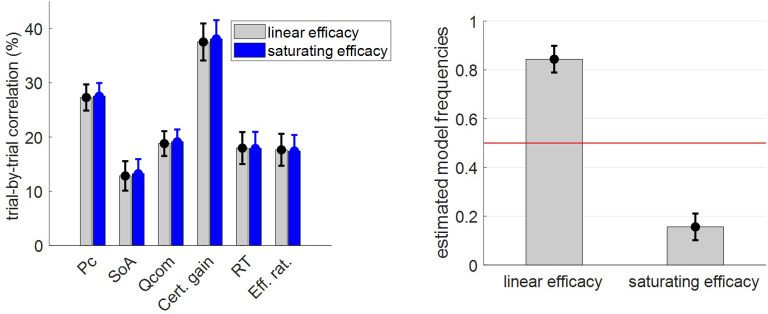
Appendix 1—figure 12. Comparisons of MCD model with linear and saturating γ-effects.
Left panel: The mean within-subject (across-trial) correlation between observed and postdicted data (y-axis) is plotted for dependent variable (x-axis, from left to right: choice confidence, spreading of alternatives, change of mind, certainty gain, RT and subjective effort ratings) and each model (gray: MCD with linear efficacy, blue: MCD with saturating efficacy); error bars depict s.e.m. Right panel: Estimated model frequencies from the random-effect group-level Bayesian model comparison; error bars depict posterior standard deviations.

