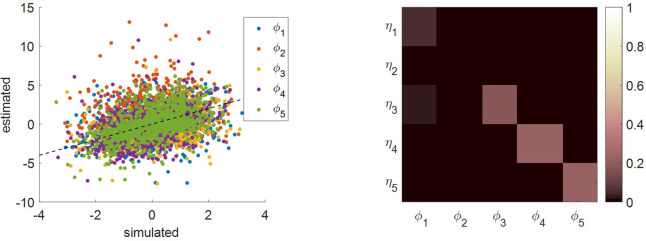
Appendix 1—figure 5. Comparison of simulated and estimated MCD parameters.
Left panel: estimated parameters (y-axis) are plotted against simulated parameters (x-axis). Each dot is a Monte-Carlo simulation and different colors indicate distinct parameters (blue: efficacy type #1, red: efficacy type #2, yellow: unknown weight of consequential choices on decision importance, violet: intrinsic cost of effort, green: unknown weight of penalized choices on effort cost). The black dotted line indicates the identity line (perfect estimation). Right panel: Parameter recovery matrix: each line shows the squared partial correlation coefficient between a given estimated parameter and each simulated parameter (across 1000 Monte-Carlo simulations). Diagonal elements of the recovery matrix measure ‘correct estimation variability’, i.e. variations in the estimated parameters that are due to variations in the corresponding simulated parameter. In contrast, non-diagonal elements of the recovery matrix measure ‘incorrect estimation variability’, that is, variations in the estimated parameters that are due to variations in other parameters. Perfect recovery would thus exhibit a diagonal structure, where variations in each estimated parameter are only due to variations in the corresponding simulated parameter. In contrast, strong non-diagonal elements in recovery matrices signal pairwise non-identifiability issues.

