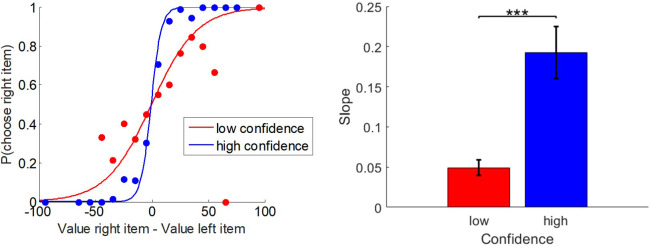
Appendix 1—figure 6. Relationship between choices, pre-choice value ratings, and choice confidence.
Left panel: the probability of choosing the item on the right (y-axis) is shown as a function of the pre-choice value difference (x-axis), for high- (blue) versus low- (red) confidence trials. The plain lines show the logistic prediction that would follow from group-averages of the corresponding slope estimates. Right panel: the corresponding logistic regression slope (y-axis) is shown for both high- (blue) and low- (red) confidence trials (group means ± s.e.m.).

