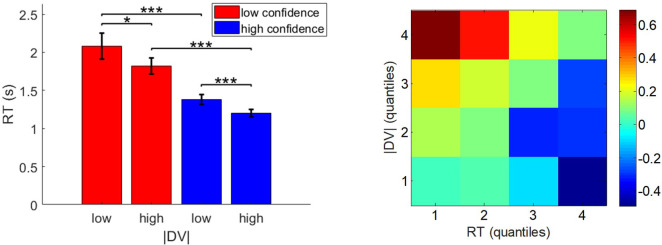
Appendix 1—figure 7. Relationship between pre-choice value ratings, choice confidence, and response times.
Left panel: response times (y-axis) are plotted as a function of low- and high- |ΔVR0| (x-axis) for both low- (red) and high- (blue) confidence trials. Error bars represent s.e.m. Right panel: A heatmap of mean z-scored confidence is shown as a function of both response time (x-axis) and |ΔVR0| (y-axis).

