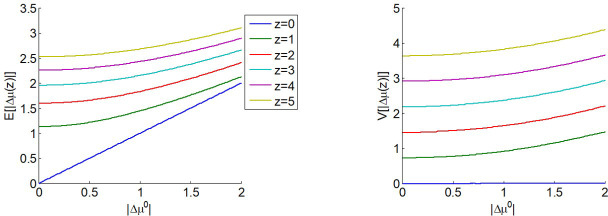
Figure 2. The expected impact of allocated resources onto value representations.
Left panel: the expected absolute mean difference (y-axis) is plotted as a function of the absolute prior mean difference (x-axis) for different amounts of allocated resources (color code), having set type #2 effort efficacy to unity (i.e. ). Right panel: Variance of the absolute mean difference; same format.

