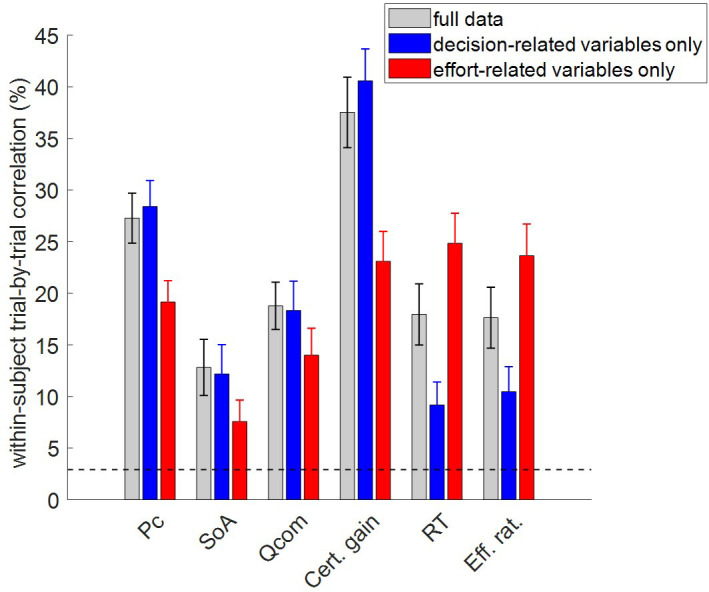
Figure 4. Accuracy of model postdictions and out-of-sample predictions.

The mean within-subject (across-trial) correlation between observed and predicted/postdicted data (y-axis) is plotted for each variable (x-axis, from left to right: choice confidence, spreading of alternatives, change of mind, certainty gain, RT and subjective effort ratings), and each fitting procedure (gray: full data fit, blue: decision-related variables only, and red: effort-related variables only). Error bars depict standard error of the mean, and the horizontal dashed black line shows chance-level prediction accuracy.
