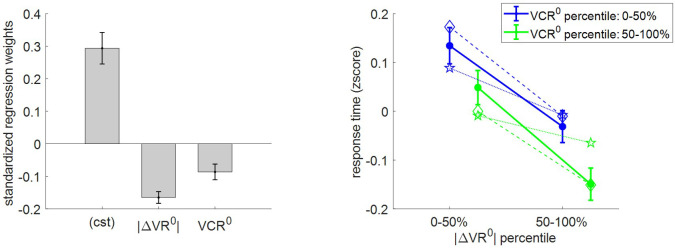
Figure 5. Three-way relationship between RT, value, and value certainty.
Left panel: Mean standardized regression weights for |ΔVR0| and VCR0 on log-RT (cst is the constant term); error bars represent s.e.m. Right panel: Mean z-scored log-RT (y-axis) is shown as a function of |ΔVR0| (x-axis) and VCR0 (color code: blue = 0–50% lower quantile, green = 50–100% upper quantile); solid lines indicate empirical data (error bars represent s.e.m.), star-dotted lines show out-of-sample predictions and diamond-dashed lines represent model postdictions.

