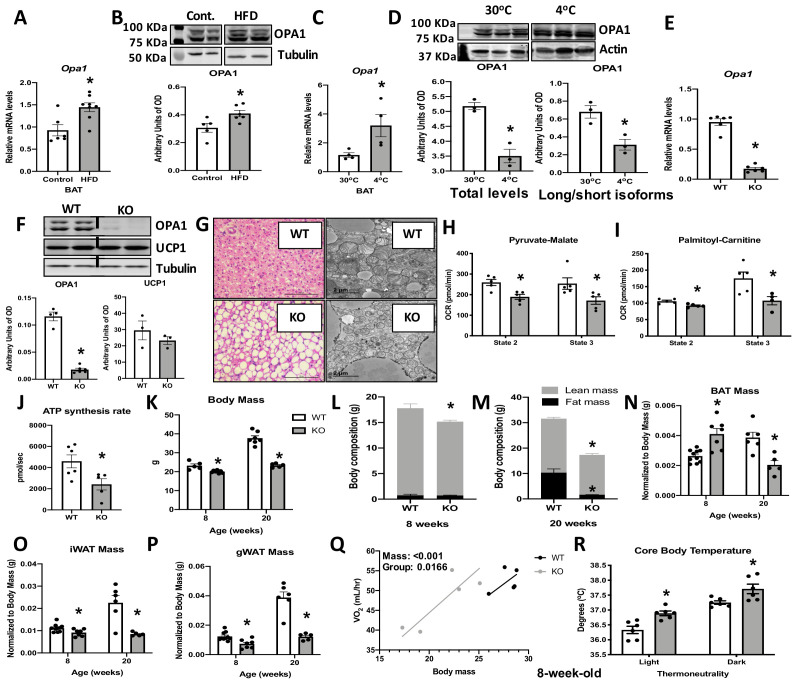
Figure 1. Optic atrophy 1 (OPA1) deficiency leads to mitochondrial dysfunction in brown adipose tissue (BAT), while improving energy balance and thermoregulation in mice.
(A, B) OPA1 expression in BAT of wild-type (WT) mice fed either control (10% fat) or a high-fat diet (HFD 60% fat) for 12 weeks. (A) Opa1 mRNA expression in BAT. (B) Representative immunoblot of OPA1 and densitometric analysis of OPA1 normalized by tubulin (images were cropped from the same membrane). (C, D) OPA1 expression in BAT of WT mice maintained at 30°C or 4°C for 3 days. (C) Opa1 mRNA expression in BAT. (D) Representative immunoblot of OPA1 and densitometric analysis of OPA1 (total levels and long/short isoforms – images were cropped from the same membrane). (E–J) Morphological and functional characterization of BAT from 8-week-old OPA1 BAT KO mice (KO). (E) Opa1 mRNA expression in BAT. (F) Representative immunoblot in BAT of OPA1 and UCP1 and densitometric analysis normalized to tubulin (dashed line separates genotypes). (G) Representative images of H&E-stained histological sections and electron micrographs of BAT from 8-week-old WT and KO mice (n = 3). Scale bar = 100 μm and 2 μm, respectively. (H, I) Functional analysis of mitochondria isolated from BAT of WT and KO mice. (H) Basal (state 2) and ADP-stimulated (state 3) pyruvate-malate-supported oxygen consumption rates (OCRs). (I) State 2 and state 3 palmitoyl-carnitine-supported OCR. (J) Palmitoyl-carnitine-supported ATP synthesis rates. (K–P) Body mass and body composition in 8- and 20 week-old WT and KO mice. (K) Body mass (8 and 20 weeks of age). (L) Body composition (8 weeks of age). (M) Body composition (20 weeks of age). (N) BAT mass. (O) Inguinal white adipose tissue (iWAT) mass. (P) Gonadal white adipose tissue mass (gWAT). (Q) Regression plot comparing oxygen consumption as a function of body mass in mice housed at 30°C. (R) Core body temperature in 8-week-old mice housed at 30°C. Data are expressed as means ± SEM. Significant differences were determined by Student's t‐test, using a significance level of p<0.05. *Significantly different vs. WT mice. VO2 data was analyzed by ANCOVA.


