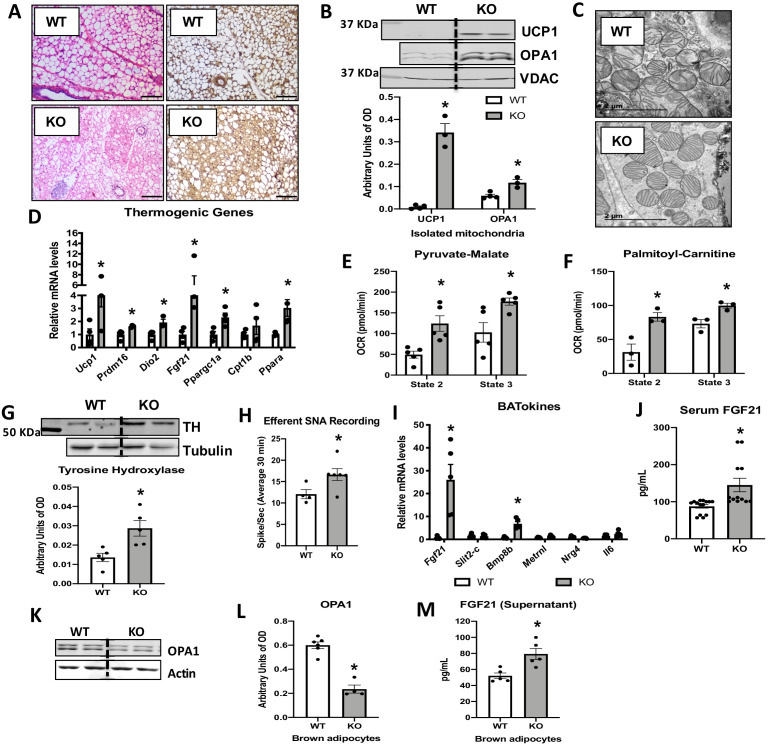
Figure 3. Optic atrophy 1 (OPA1) deletion in brown adipose tissue (BAT) results in compensatory browning of white adipose tissue (WAT).
(A–G) Morphological and functional characterization of inguinal white adipose tissue (iWAT) in 8-week-old wild-type (WT) and knockout (KO) mice. (A) Representative iWAT sections stained with H&E or after immunohistochemistry against uncoupling protein 1 (UCP1). Scale bar = 100 μm (n = 3). (B) Representative immunoblot (dashed line separates genotypes) and densitometric analysis of UCP1 and OPA1 in mitochondria isolated from iWAT normalized to VDAC. (C) Representative electron micrographs of iWAT from WT and KO mice. Scale bar = 2 µm (n = 3). (D) mRNA expression of thermogenic genes. (E, F) Functional analysis of mitochondria isolated from iWAT. (E) State 2 and state 3 pyruvate-malate-supported mitochondrial oxygen consumption rate (OCR). (F) State 2 and state 3 palmitoyl-carnitine-supported mitochondrial OCR. (G) Representative immunoblot (dashed line separates genotypes) and densitometric analysis of tyrosine hydroxylase (TH) normalized to tubulin. (H) Efferent nerve recording in iWAT. (I) mRNA levels of BATokines in BAT extracts from 8-week-old WT and KO mice. (J) Serum levels of fibroblast growth factor 21 (FGF21) in random-fed 8-week-old WT and KO mice. (K) Representative immunoblots of OPA1 normalized to actin in primary brown adipocytes (dashed line separates genotypes). (L) Densitometric analysis of OPA1 normalized to tubulin in brown adipocytes. (M) FGF21 levels measured in the culture media collected from WT and OPA1-deficient brown adipocytes. Data are expressed as means ± SEM. Significant differences were determined by Student's t‐test, using a significance level of p<0.05. *Significantly different vs. WT mice.


