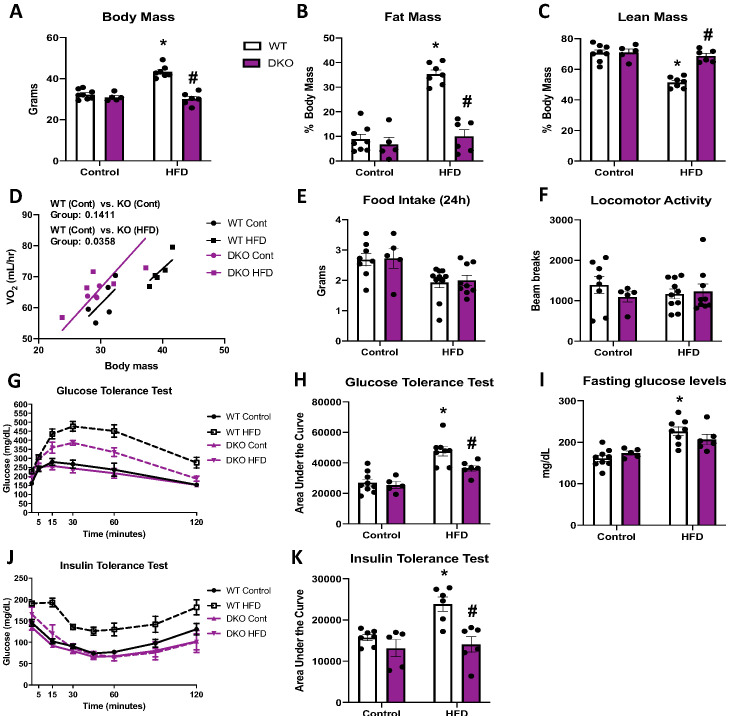
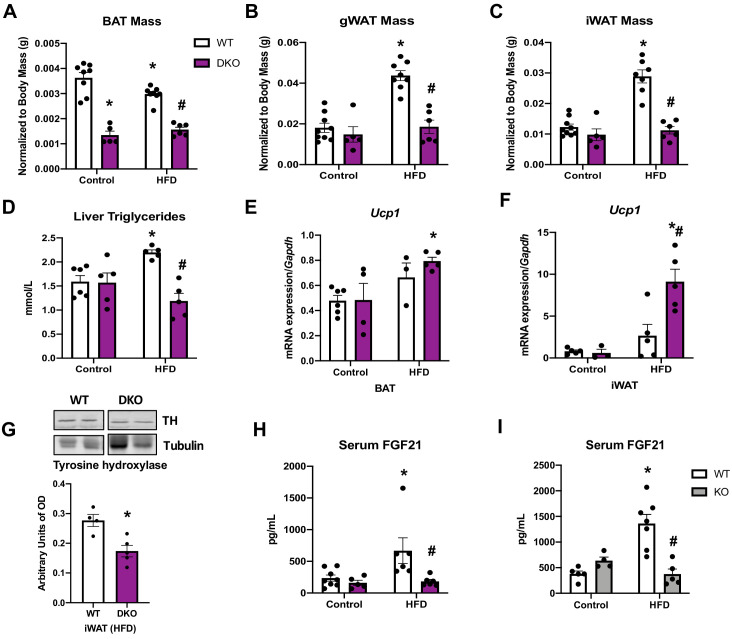
Figure 6. Brown adipose tissue (BAT)-derived fibroblast growth factor 21 (FGF21) does not mediate resistance to diet-induced obesity in optic atrophy 1 (OPA1) BAT knockout (KO) mice.
(A–K) Data from wild-type (WT) and OPA1/FGF21 DKO mice fed either a control diet (Cont) or a high-fat diet (HFD) for 12 weeks. (A) Total body mass. (B) Percent ratio of fat mass to body mass. (C) Percent ratio of lean mass to body mass. (D) Regression plot comparing oxygen consumption as a function of body mass. (E) Food intake during a 24 hr period. (F) Locomotor activity. (G) Glucose tolerance test. (H) Area under the curve for the glucose tolerance test. (I) Fasting glucose levels. (J) Insulin tolerance test. (K) Area under the curve for the insulin tolerance test. Data are expressed as means ± SEM. Significant differences were determined by two-way ANOVA, using a significance level of p<0.05. *Significantly different vs. WT control, #significantly different vs. WT HFD. VO2 data was analyzed by ANCOVA.


