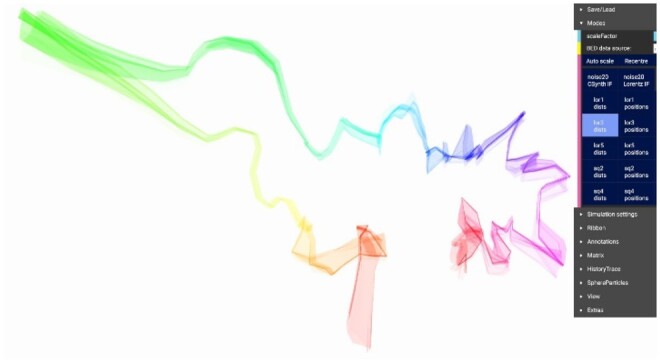
Fig. 5.

Exploration of LorDG data. GUI layout, ‘history trace’ view to compare results of modelling in 5 runs. Selecting the dark blue ‘dists’ buttons on the right-hand side selects the different imported LorDG solutions. Rainbow colouring, with hue changing along the chromosome. The ‘narrow’ regions show the techniques have very little conformation change between the solutions, the ’wide' regions have much more variation
