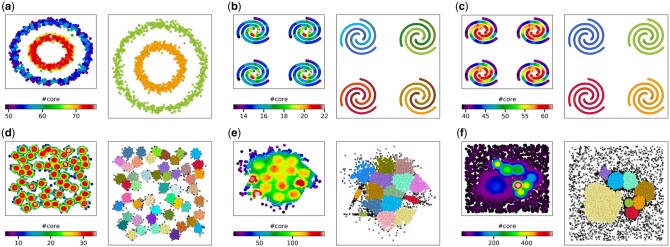
Fig. 2.
Local neighborhood density analysis for automated center and cluster determination. For each panel, the cardinality of the core of each point as detailed in the Section 2 is shown on the left. The resulting clusters are shown on the right, with clusters in different colors and identified outliers as black crosses. (a) Noisy circles dataset. (b and c) Four instances of spiral dataset with different values of the input parameter yielding different yet valid clusters. (d) The a3 dataset containing 50 Gaussian clusters. (e) The s4 dataset with highly overlapping Gaussian clusters, some with anisotropic distributions. (f) A synthetic dataset with clusters of significantly different sizes and densities taken from Density Peaks Advanced

