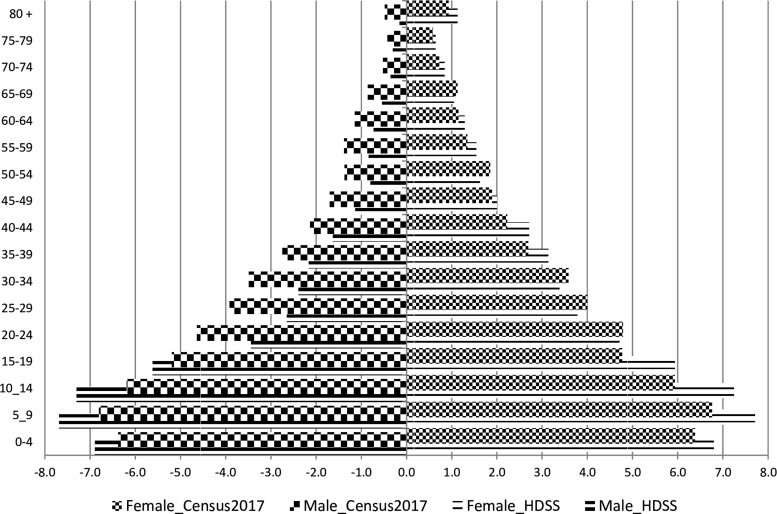
Figure 5.
Age and sex composition of the population in Manhiça district according to the national census in 2017 and according to Manhiça HDSS databases in 2019. [Source: Manhiça HDSS databases; and INE (20198)].The x-axis presents the percentage of each age-group and sex relative to the total population. Negative percentages were used only for graphical purposes (to force Excel software to display males on the left side of the y-axis, the vertical line showing a percentage of 0.0). The y- axis presents 5-years age-groups of population, in years. Male_HDSS and male_Census2017 (or female_HDSS and female_Census2017) stand for male (or female) population in Manhiça district according to Manhica HDSS and according to the national census conducted in 2017, respectively

