
Figure 1.
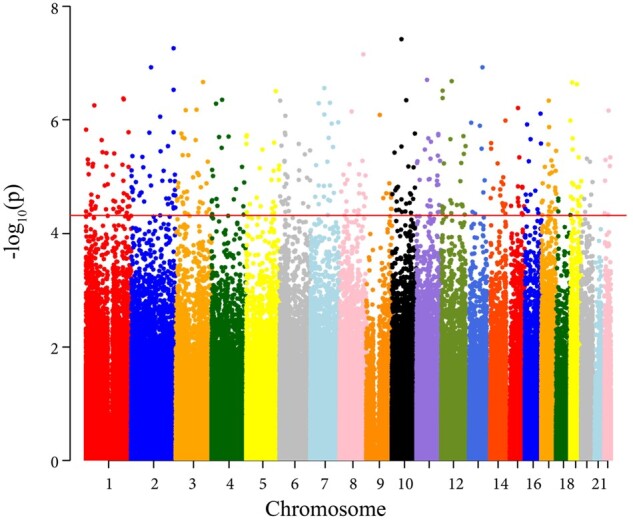
Manhattan Plot of the EWAS of diet quality. The x-axis represents chromosomal position and the y-axis represents P-values on the –log10 scale for each CpG site. The line denotes the threshold for significance P = 4.8 x 10⁻⁵.
Official websites use .gov
A
.gov website belongs to an official
government organization in the United States.
Secure .gov websites use HTTPS
A lock (
) or https:// means you've safely
connected to the .gov website. Share sensitive
information only on official, secure websites.
Manhattan Plot of the EWAS of diet quality. The x-axis represents chromosomal position and the y-axis represents P-values on the –log10 scale for each CpG site. The line denotes the threshold for significance P = 4.8 x 10⁻⁵.