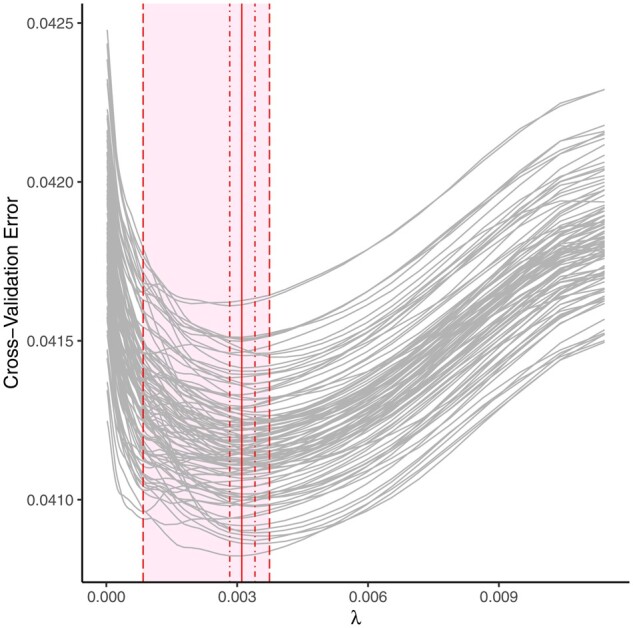
Figure 1.

Cross-validation curves for lasso models over 100 seeds. Grey curves represent results obtained from each of the 100 seeds. The vertical red line indicates the median of the best fit λ values. The inner dot-dashed lines represent the inter-quartile range of the best fit λ values. The outer dashed lines represent the minimum and maximum of the best fit λ values. All best fit λ values fell inside the shaded area.
