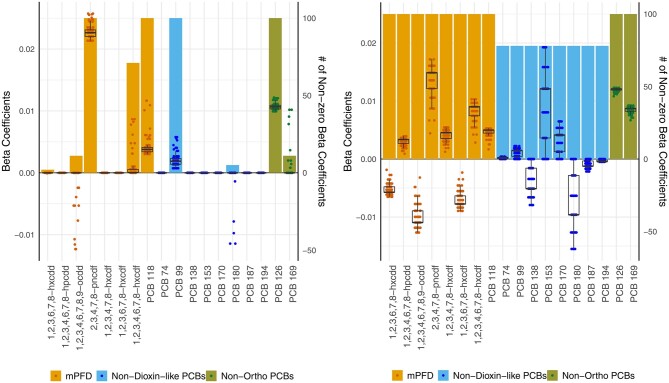
Figure 2.
(a) Lasso and (b) group lasso beta coefficients over 100 seeds. Bars correspond to the right axis and indicate the number of times a congener had a non-zero beta coefficient across all seeds. Data points and boxplots correspond to the left axis. The data points are the congeners’ beta coefficients in each of the seeds. Boxplots show the median and interquartile range for the beta coefficients of the given congener.

