
Figure 3.
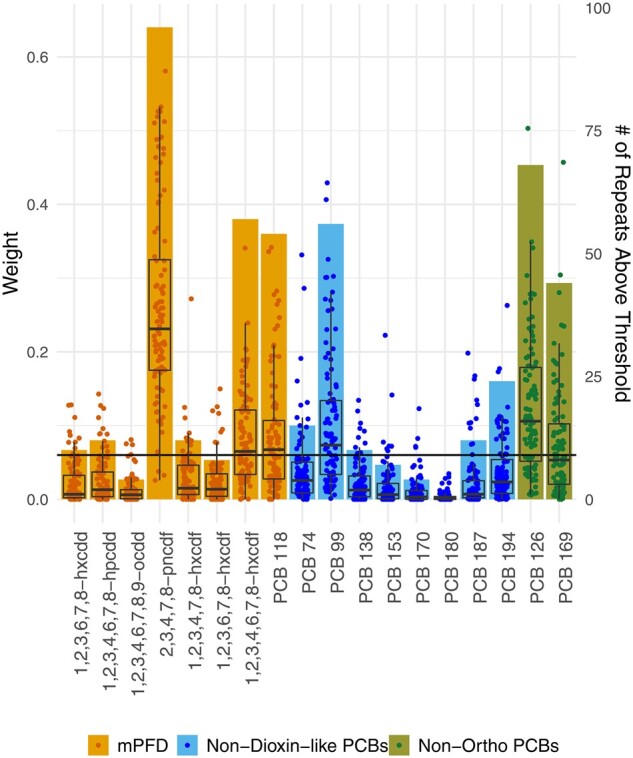
WQS estimated weights over 100 seeds. Bars correspond to the right axis and indicate the number of times a congener had a weight value above the threshold, which was calculated as 1/p (1/18 = 0.05, horizontal line) out of the 100 seeds. Data points and boxplots correspond to the left axis. The data points are the congeners’ weights in each of the seeds. The boxplots show the median and interquartile range for the weights of each congener across seeds. WQS, Weighted Quantile Sum Regression.