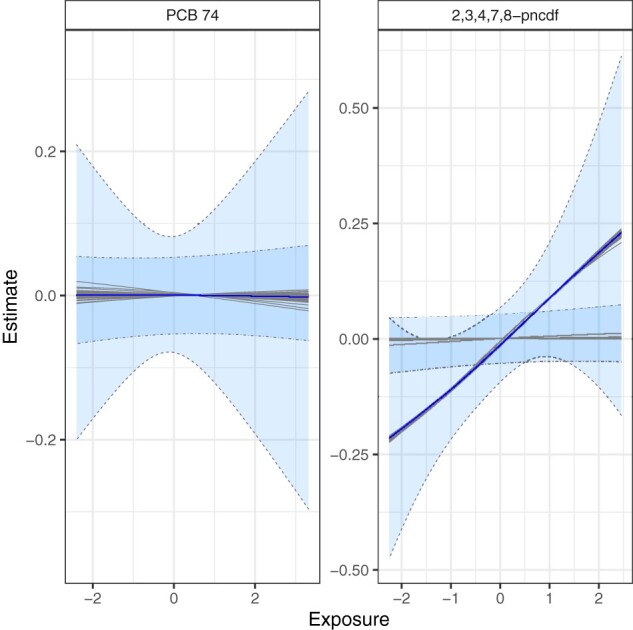
Figure 5.

Congener-specific effect estimates for two mixture members, PCB 74 (non-dioxin-like PCBs) and furan 2,3,4,7,8-pncdf (mPFD) estimated by BKMR over 100 MCMC seeds. Grey lines represent exposure–response functions for each of the 100 seeds. The blue line indicates the median across all seeds. The area between the dashed lines includes the 95% credible intervals for 96 seeds where the credible intervals around furan 2,3,4,7,8-pncdf did not include the null value at low exposure levels. The narrower dot-dashed lines represent the 95% credible intervals for the four seeds that produced null exposure–response curves for furan 2,3,4,7,8-pncdf. BKMR, Bayesian Kernel Machine Regression; MCMC, Markov Chain Monte Carlo.
