Fig. 4.
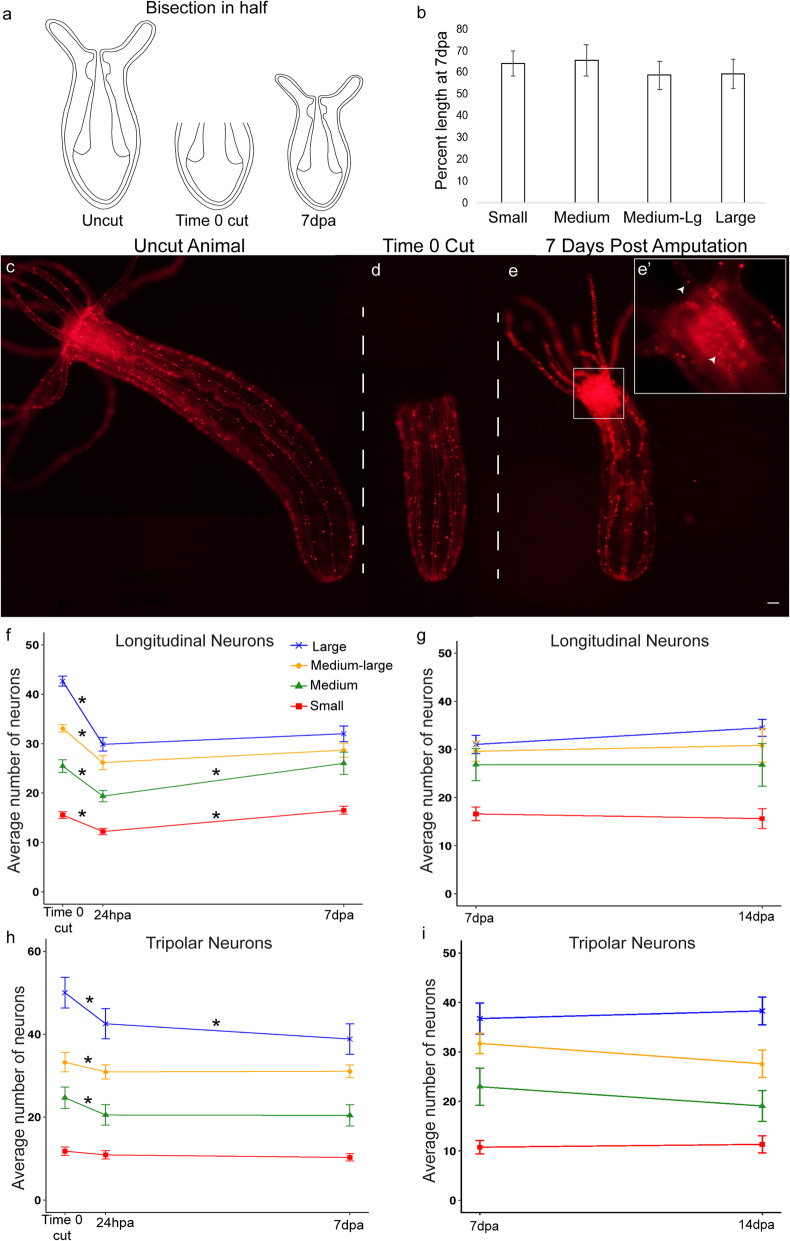
NvLWamide-like neuronal subtypes have differential responses during regeneration. a Schematic for oral bisection at ~ 50% body length. b Percent length regained in 7 day post amputation (dpa) animals bisected in half did not differ between animals of different size categories (F3,27 = 0.23, p = 0.875, ηp2 = 0.025, n = 11 small; 8 medium; 6 medium-large; 6 large). c Uncut NvLWamide-like::mCherry expressing animal. d Same animal as c at time 0 cut. e Same animal as c and d at 7dpa, with regenerated oral structures. Scale bar = 100 μm. e’ × 10 magnification of the boxed oral region in e, top and bottom arrowheads indicate tentacular and pharyngeal neurons respectively. f–i Quantification of longitudinal and tripolar neurons in regenerating animals. Lines represent the average number of neurons per radial segment in small (red), medium (green), medium-large (orange), and large (blue) animals. f Longitudinal neurons regenerated back to numbers similar to time 0 cut in the small- (p = 0.99) and medium-sized animals (p = 1.00), but did not regenerate in the larger animals by 7dpa (medium-large: p = 0.003, large: p < 0.001; F5.1,134.4 = 13.46, p < 0.001, ηp2 = 0.34; n = 29 small, 20 medium, 16 medium-large, 18 large). g Allowing animals to regenerate another 7 days did not increase longitudinal neuron number in animals of any size category (F3,42 = 0.86, p = 0.47, ηp2 = 0.06; n = 12 small; 12 medium; 10 medium-large; 12 large). h Tripolar neurons did not regenerate by 7dpa (F4.5,116.2 = 3.93, p = 0.003, ηp2 = 0.13; n = 28 small, 19 medium, 16 medium-large, 18 large). i Allowing animals to regenerate another 7 days did not increase tripolar neuron number in animals of any size category (F3,42 = 2.04, p = 0.122, ηp2 = 0.13). Regardless of size, there was a near significant decrease in tripolar neurons between 7dpa and 14dpa (F1,42 = 3.97, p = 0.053, ηp2 = 0.09; n = 12 small; 12 medium; 9 medium-large; 11 large). See Additional file 15: Table S5 for full model results. Data points and bars represent means ± SEM, *p ≤ 0.05

