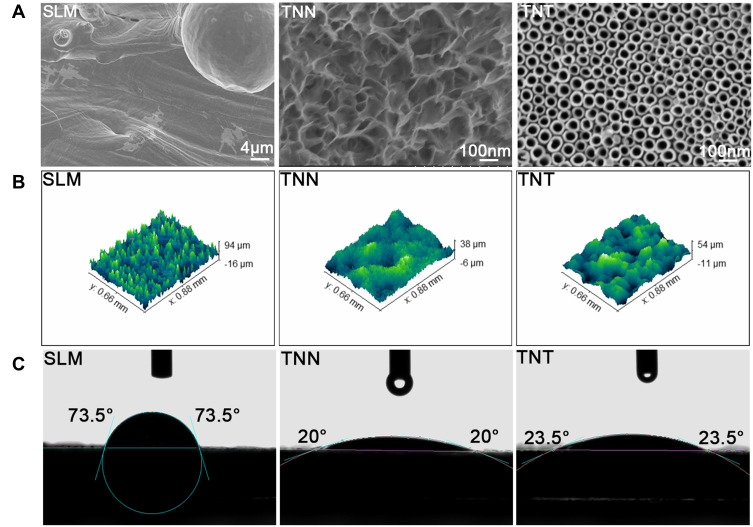
Figure 3.
Surface characterization of the samples: (A) SEM images showing the surface topography of samples. SLM group (scale bar = 4 µm) showing waving surface with unmelted titanium particles and spheres, TNN group (scale bar = 100 nm) showing the nano-nets with 100–120 nm in diameter, TNT group (scale bar = 100 nm) showing the well-arranged nanotubes with 70 nm in diameter; (B) Surface roughness profiles of the samples; (C) Water contact angles of the samples.

