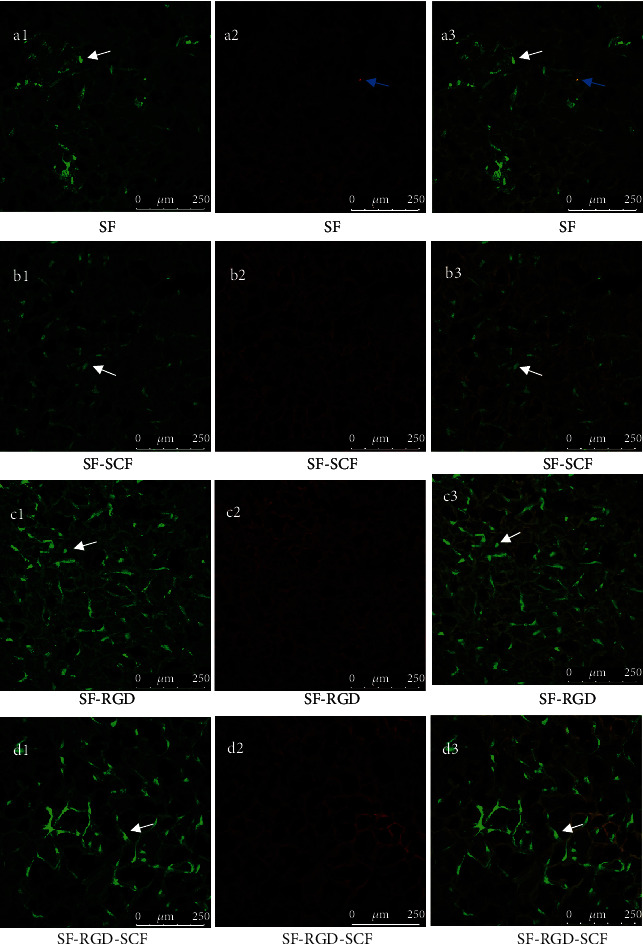
Figure 8.

Laser scanning confocal microscopy images showing live and dead cells after 7 d seeding. Live cells show as fluorescent green (a1, b1, c1, d1). Dead cells show as red (a2, b2, c2, d2). Merged pictures of live and dead cells (a3, b3, c3, d3) (white arrows: live cells; blue arrows: dead cells).
