
Fig 3.
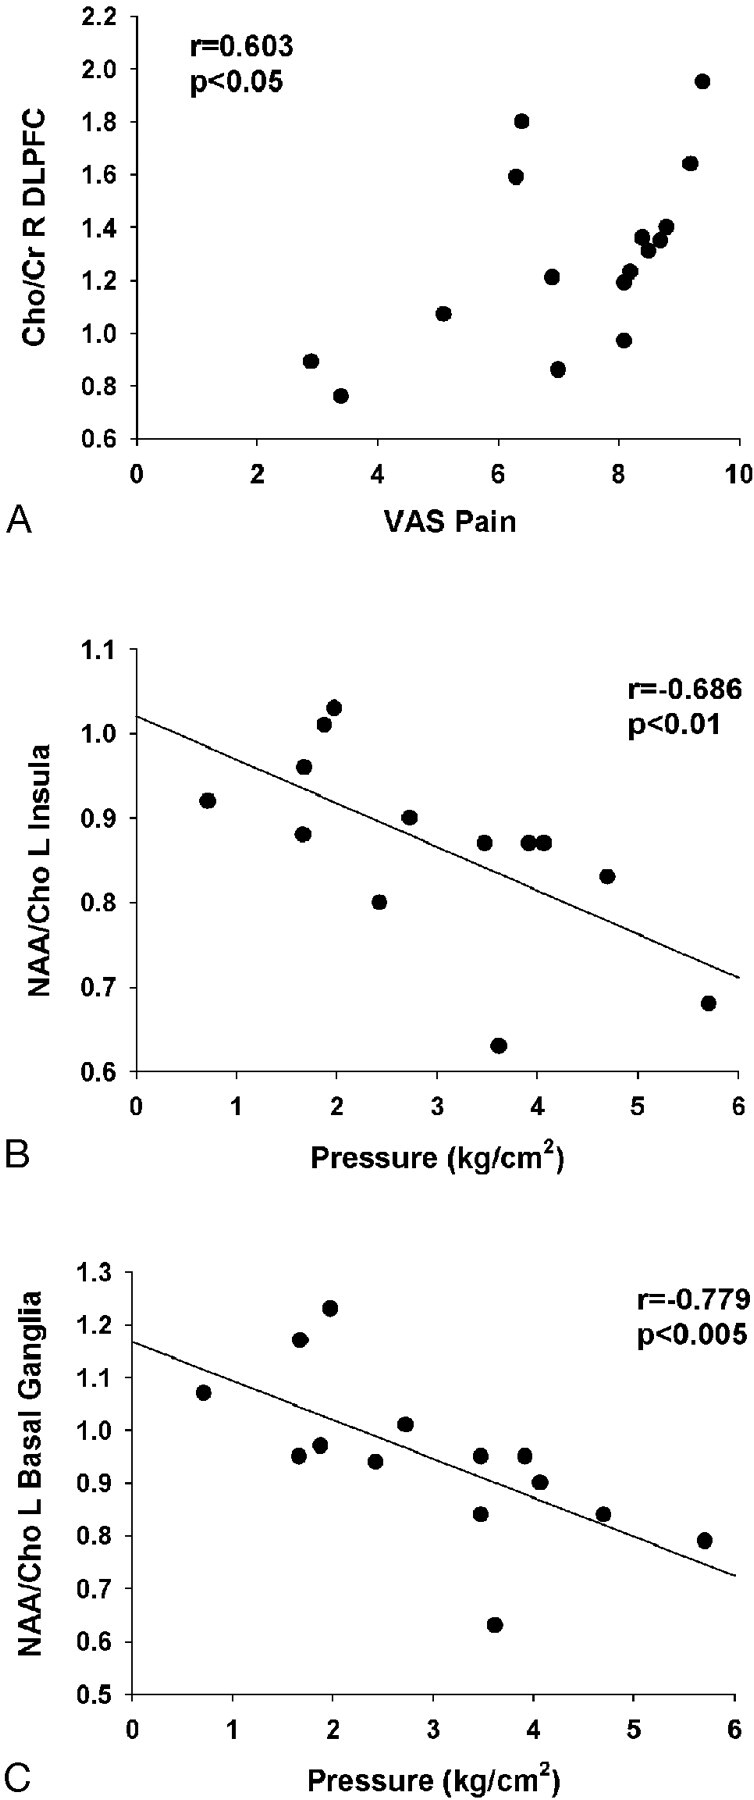
Significant correlations between metabolite ratios and clinical symptoms. Correlations between Cho/Cr ratios in the right DLPFC and clinical pain scores on the visual analog scale (VAS) are shown in A. Correlations between evoked pain thresholds and NAA/Cho ratios in the left insula and left basal ganglia are shown in B and C, respectively.