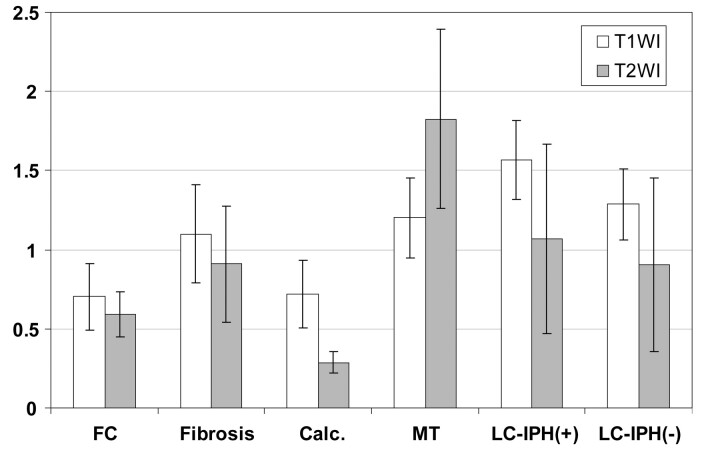
Fig 1.
The rSI of plaque components on T1- and T2-weighted images. With use of specimens with matching MR images and excised plaque sections, the rSI of plaque components was calculated in relationship to the sternocleidomastoid muscle on T1-weighted images and the submandibular gland on T2-weighted images. On T1-weighted images, rSI significantly differed among most components, but not between FC and calcification, fibrosis and myxomatous tissues, fibrosis and LC without IPH, and myxomatous tissue and LC without IPH. On T2-weighted images, rSI significantly differed between FC and the other components except for LC without IPH, and between calcification and the other components. Bars indicate SD. FC indicates fibrous cap; Calc., calcification; MT, myxomatous tissue; LC-IPH(+), LC with intraplaque hemorrhage; and LC-IPH(-), LC without intraplaque hemorrhage.

