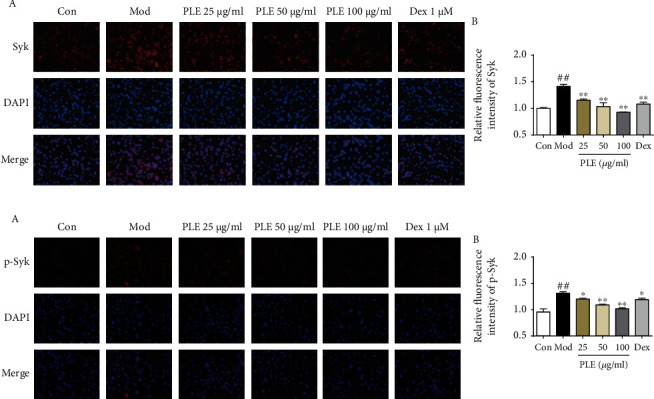
Figure 4.

Effects of PLE on the expressions and phosphorylation of Syk in RBL-2H3 cells in vitro. (a) (A) The representative photomicrographs (magnification, ×200) of Syk and (B) their relative fluorescence intensity investigated by IF staining (n = 3). (b) (A) The representative photomicrographs (magnification, ×200) of p-Syk and (B) their relative fluorescence intensity investigated by IF staining (n = 3). ##P < 0.01vs. control group; ∗P < 0.05 and ∗∗P < 0.01vs. model group.
