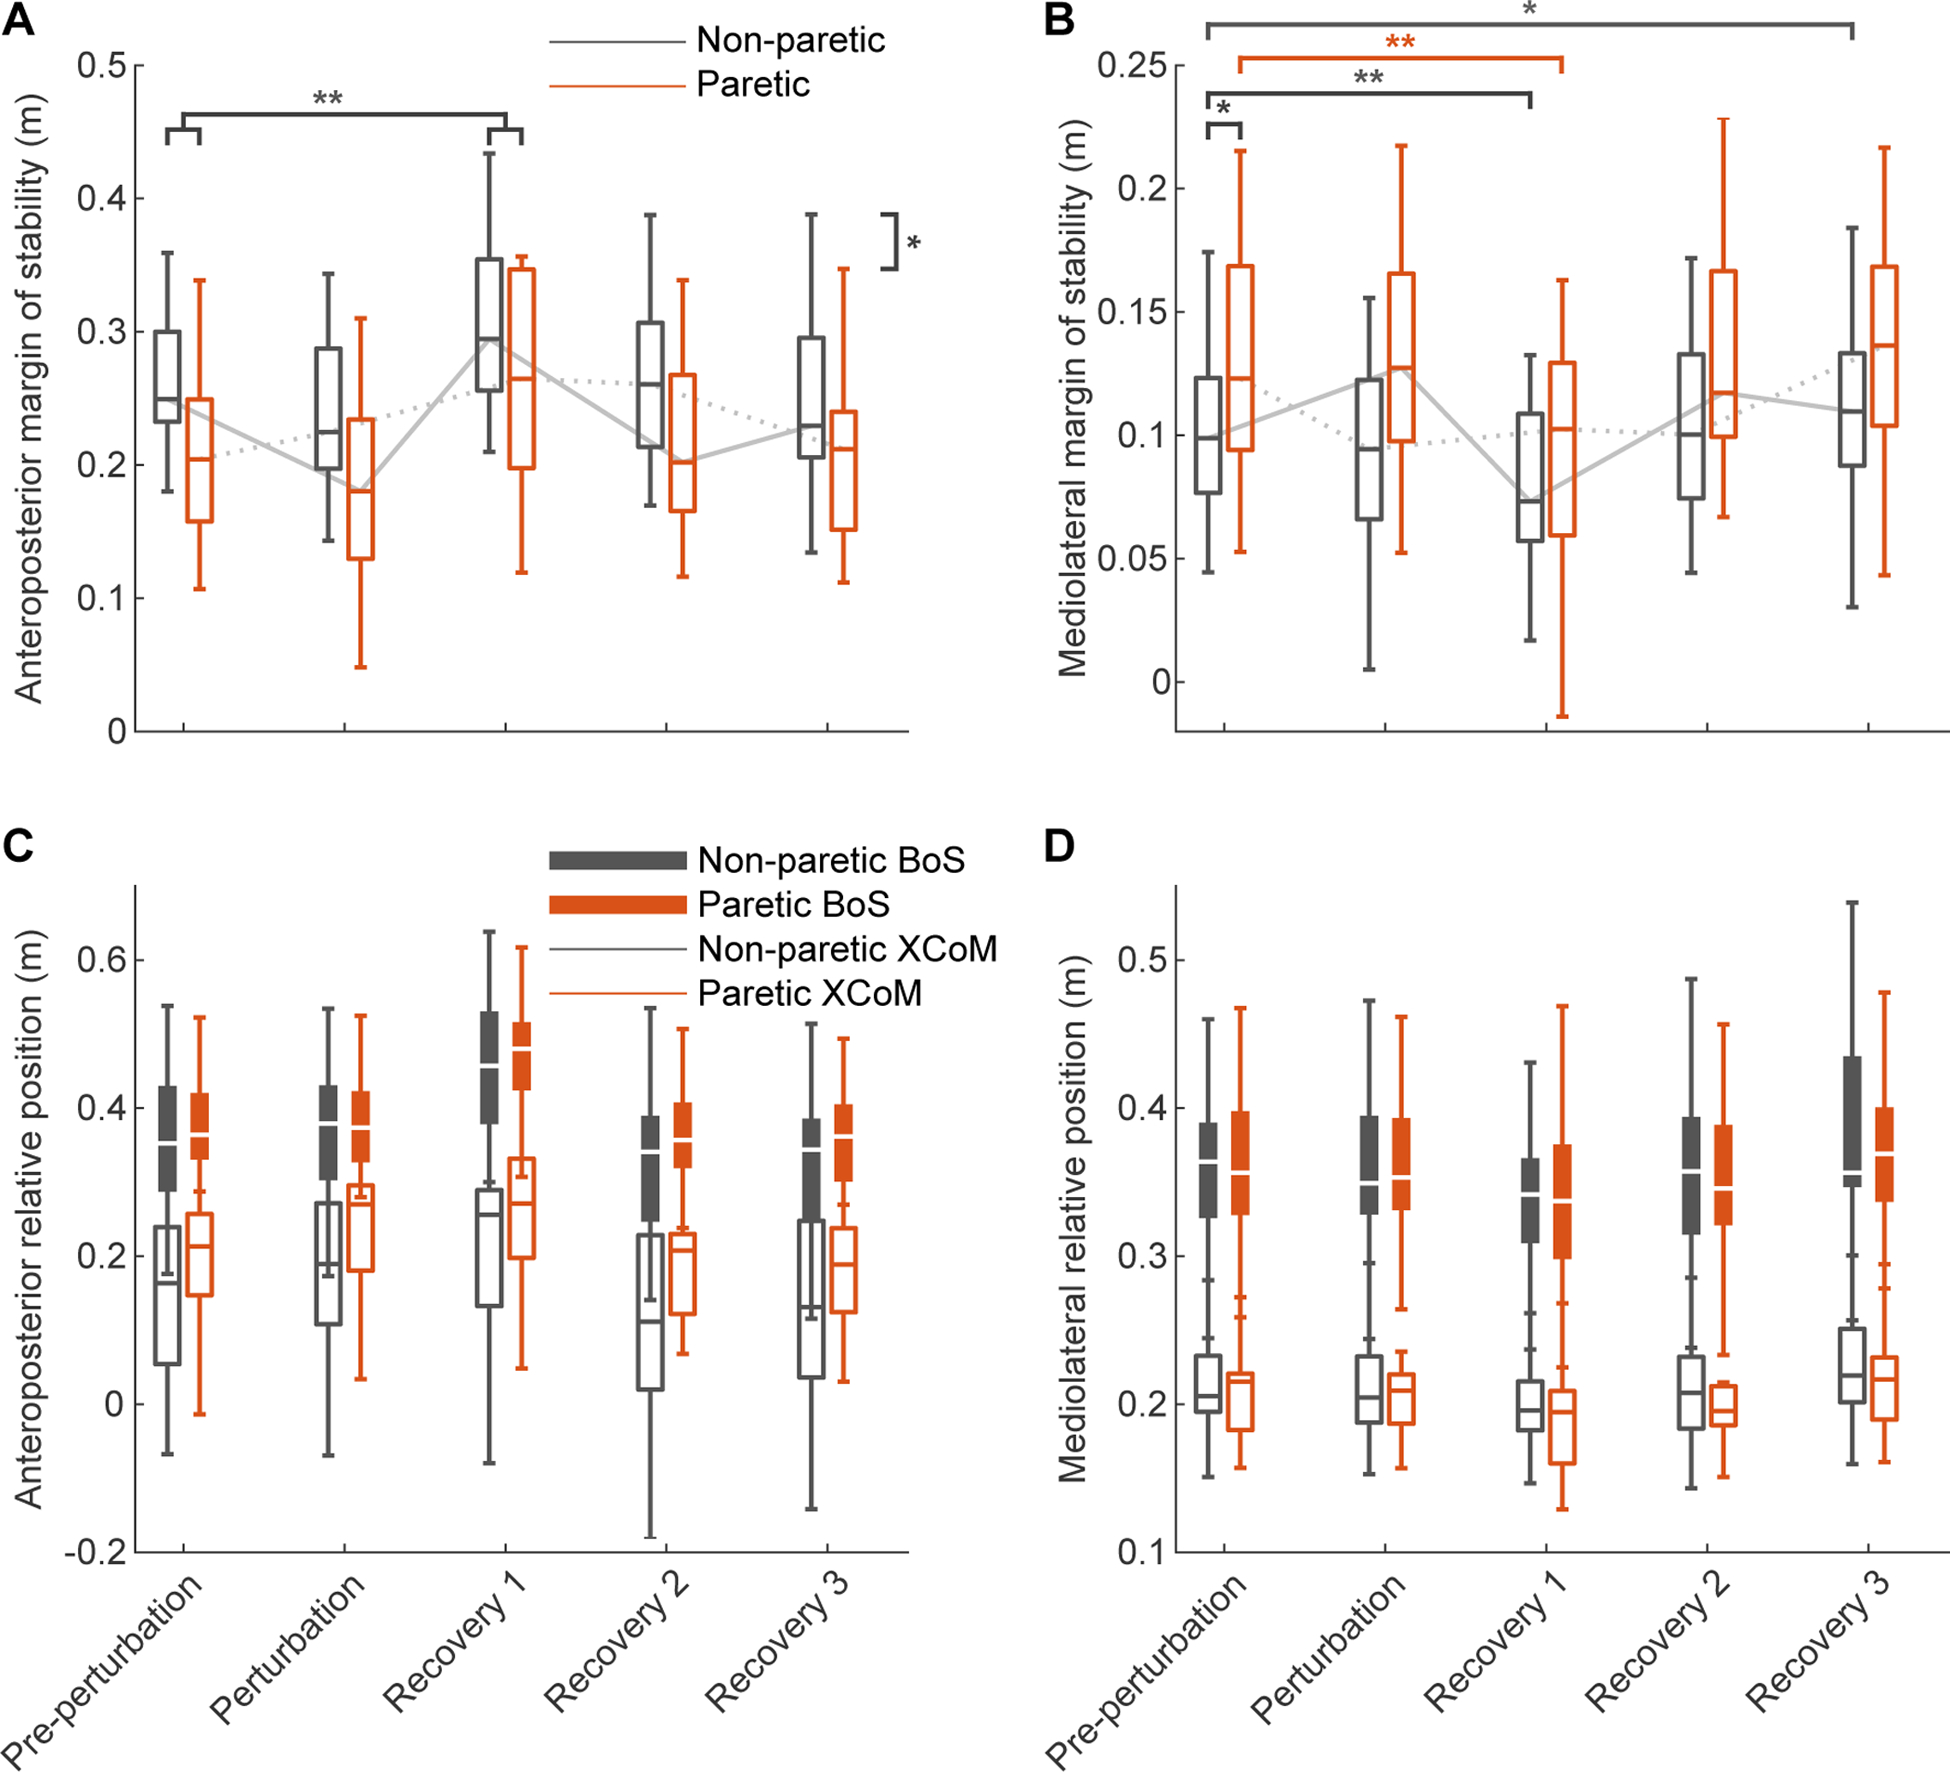
Fig. 1 -.

Group distribution of margins of stability for pre-perturbation, perturbation, and recovery steps (N=21). A) Paretic and non-paretic anteroposterior Margins of Stability (MoS). B) Paretic and non-paretic mediolateral MoS. C) Paretic and non-paretic anteroposterior edge of the Base of Support (BoS; leading leg 1st distal phalanx marker) and Extrapolated Center of Mass (XCoM) positions relative to the contralateral edge of the BoS (trailing leg 1st distal phalanx marker. D) Paretic and non-paretic mediolateral edge of the BoS (leading leg 5th metatarsal marker) and XCoM positions relative to the contralateral BoS (trailing leg 5th metatarsal marker). Asterisks indicates significant differences in MoS between limbs or phases (* p < 0.05, ** p < 0.001). The order of steps alternates between paretic and non-paretic, based on the side that was perturbed. The grey dotted lines indicate the series of steps in which the non-paretic leg was perturbed, the solid grey lines the series of steps in which the paretic leg was perturbed.
