Abstract
Summary
Hospital use by patients with osteogenesis imperfecta was largely unknown. This study found that the English NHS provides a significant number of hospital admissions to these patients, translating into large costs to the NHS. Admissions and costs both increased over time. Children under 14 years old accounted for more of the admissions and costs than any other age group.
Introduction
The aim of this study was to characterise hospital use by patients with osteogenesis imperfecta (OI) in the English National Health Service (NHS).
Methods
Routinely collected aggregate data about all inpatient hospital records from patients with OI were used for the period 1 April 2014 to 31 March 2018. Information was extracted on number of admissions, number of patients, length of stay, and costs. Hospital use was summarised using descriptive statistics, categorising patients into 5-year age groups.
Results
There were 16,245 hospital admissions for OI patients during the analysis period, with a total cost to the NHS of £24,052,451. Of the 4370 patients involved, 2700 (62%) were female. Female patients averaged 3.3 admissions per year and male patients 4.4 admissions per year. Patients aged 0 to 14 years old accounted for 54% of all admissions. Those aged 90 to 94 years had the longest average length of stay per admission (10.5 days) of any age group. Elective admissions cost on average £1260 and non-elective admissions £2529. Over the 4-year study period, number of admissions increased on average by 2.1% per year and number of patients by 6.4% per year.
Conclusion
The treatment of patients with OI is associated with a significant number of hospital admissions at an important cost for the NHS, with both number of admissions and costs increasing over time. Children below the age of 14 years had more admissions at a greater total cost than other ages, while the oldest adults had longer average stays and higher costs per admission.
Keywords: Brittle bone disease, Health economic burden, HES data, Hospital costs, Osteogenesis imperfecta, Routinely collected data
Introduction
Osteogenesis imperfecta (OI) is a spectrum of rare genetic disorders characterised by low bone mass, reduced bone material strength, and specific clinical features and inheritance patterns [1, 2]. Patients with OI are susceptible to skeletal deformity and fragility throughout their lives. However, they are a heterogeneous group and the severity of their clinical symptoms varies from mild to severe. Their quality of life is lower than that of the general population. Children report being most affected in their physical functioning and school functioning [3, 4], while adults report being most affected in their physical functioning [5, 6], pain/discomfort, and mobility [7].
The management of OI requires a multidisciplinary team of specialists including surgeons, rheumatologists, endocrinologists, paediatricians, and allied health professionals [8]. Its treatment is not without complications, and the disease burden for patients and the healthcare system is considerable. Before healthcare services for people with OI can be redesigned to be more effective, efficient, and patient-friendly, the volume and pattern of current activity must be understood. However, information on hospital use by patients with OI is very limited. We therefore aimed to characterise current hospital use by patients with OI in the English National Health Service (NHS).
Methods
Study design and setting
We analysed routinely collected aggregate data from patients with OI from all 451 hospital trusts in the NHS in England [9] from 1 April 2014 to 31 March 2018. We sourced data from the Vantage platform, which was provided by Health iQ in an aggregated format rather than patient-level data.
Secondary care data were taken from the English Hospital Episode Statistics (HES) database produced by the Health and Social Care Information Centre [10]. NHS hospital care in England, including community care and mental health services, is managed by hospital trusts. The data extracted reflected inpatient hospital records reported by HES Admitted Patient Care (HES APC). HES APC contains data on all hospital admissions to the NHS and independent sector providers funded by the NHS [9]. Hospital admissions are classified as elective or non-elective. Elective admissions are defined as those occurring when the decision to admit and the actual admission happen at different times, such as admissions originating from a waiting list. Non-elective admissions are defined as those that have not been arranged in advance, such as emergency admissions [11].
A hospital admission in HES APC is referred to as a “spell” and is defined as an uninterrupted inpatient stay at a particular hospital. Several finished consultant episodes may be included in one spell, when a patient is seen by various consultants during one stay. However, a spell does not include transfers between different hospitals, and a new spell begins if a patient is transferred to another hospital [9].
The acquired data files were organised by financial year (starting on 1 April) and were updated monthly. We analysed data from 1 April 2014 to 31 March 2018, corresponding to 4 full financial years.
Study population
Aggregate data about admissions reporting International Classification of Diseases-10 (ICD-10) diagnostic code Q78.00 (osteogenesis imperfecta) were retrieved as hospital admissions of patients with OI. Up to 20 ICD-10 codes can be recorded for each admission record, with the first code referred to as the primary diagnosis and the rest as secondary diagnoses. If an OI code was reported as the primary diagnosis, then OI was the main reason for the admission, for instance to provide treatment for the condition. If an OI code was reported as a secondary diagnosis, then the reason for admission was not OI, but the fact that the patient has OI was flagged. We extracted data for both primary and secondary OI diagnoses. Admission records were only accessible in aggregate form, categorised by variables such as financial year, sex, and age group. We did not have access to individual patient follow-up or characterisation beyond these extracted tables. Following NHS Digital guidelines to ensure confidentiality, we used small number suppression, rounding of patient counts, and rounding of admission counts on all outputs.
Variables
We extracted number of admissions, number of patients, length of stay (total bed days), waiting time (days from referral date to treatment start date), and costs from the data files provided by the Vantage platform. We report the collected aggregate data categorised by sex, age group, admission method (elective and non-elective), patient classification (day-case, ordinary, and regular), and procedure codes (four-character OPCS codes, a classification of interventions and procedures used by healthcare providers in England).
Day-case was defined as an inpatient elective admission for treatment during the course of the day without staying overnight. Ordinary was defined as an inpatient elective or non-elective admission for treatment and staying for at least one night. Regular was defined as an inpatient elective admission that was part of a planned series of admissions for an ongoing regime of broadly similar treatments, with the patient discharged on the same day [12].
Costs
We extracted costs directly from the platform as calculated by the data provider. We treated these costs as estimates because they were calculated per spell but retrieved in aggregate form. Reported cost estimates were based on the NHS national tariff according to core Healthcare Resource Group (HRG) codes assigned to each spell. We also included additional costs related to excess bed days for spells with lengths of stay beyond the trim point of the respective HRG code. However, unbundled HRG codes (specific elements of activity and costs separated from core HRGs, such as diagnostic imaging) were not available [13]. The reported figures are therefore a conservative estimate of the cost to the NHS, as the NHS reimburses hospitals for the care provided to patients admitted.
Data analysis
Descriptive statistics and figures were used to summarise hospital use by patients with OI. We examined the association between sex and number of admissions, number of patients, and costs for either primary or secondary OI diagnosis, only primary OI diagnosis, or only secondary OI diagnosis. We used regression analysis to investigate whether the number of admissions and patients increased over the 4 years of analysis. We use figures to demonstrate how the number of admissions per year, costs per year, average length of stay per admission, and average cost per admission differed by age group. We also report the number of admissions, average cost, and average waiting time by admission method.
To identify the main drivers of admissions and costs for people with OI, admissions were categorised according to the 25 clinically relevant procedure and intervention OPCS chapters used by the NHS (e.g., “Nervous System”, “Diagnostic Imaging, Testing and Rehabilitation”, and “Bones and Joints of Skull and Spine”) [14]. Admissions were categorised separately for patients with OI as primary or secondary diagnosis.
Results
Number and costs of admissions
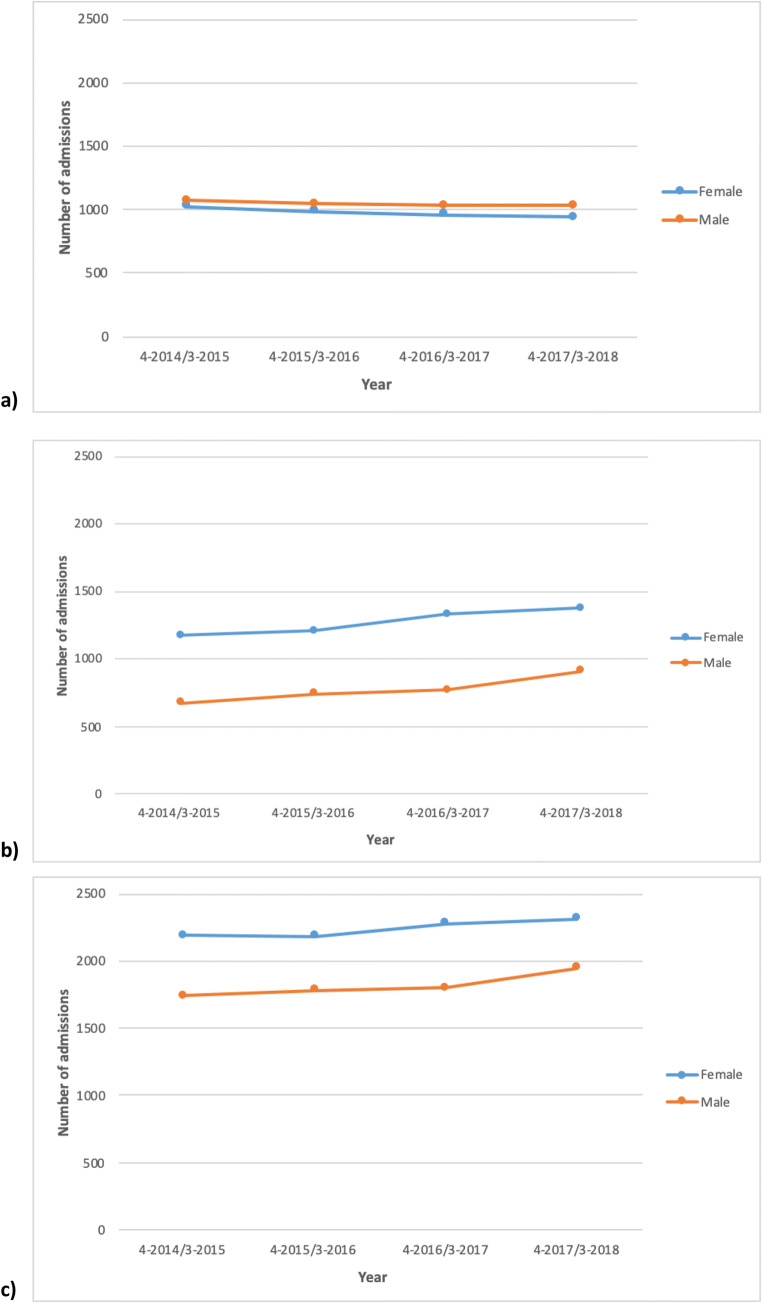
Of the 72,376,430 hospital admissions for the whole NHS between 1 April 2014 and 31 March 2018, there were 16,245 hospital admissions reported for 4370 patients with a primary or secondary OI diagnosis, equivalent to a mean of 4061 admissions per year and 0.02% of all NHS admissions in England. The total cost for these admissions was £24,052,451 for the 4 years of analysis, or an average annual cost of £6,013,113. Female patients accounted for 8970 (55%) of these admissions. Of the 4370 patients with either primary or secondary OI diagnoses, the 2700 (62%) female patients had an average 3.3 admissions per patient per year, while the 1670 (32%) male patients had an average 4.4 admissions per patient per year (Fig. 1).
Fig. 1.
Number of admissions for female and male patients with a primary (a), secondary (b), or either primary or secondary (c) OI diagnosis
Primary OI diagnoses accounted for 8085 hospital admissions for the entire period, equivalent to a mean 2021 admissions per year. The total cost for these admissions was £7,842,664 over the 4 years, with a mean annual cost of £1,960,666. Female patients accounted for 3905 (48%) of these admissions. Of the 1140 patients with primary OI diagnoses, the 580 (51%) female patients had an average 6.7 admissions per year. The male patients had an average 7.5 admissions per year (Fig. 1).
Secondary OI diagnoses accounted for 8175 admissions for the entire period, equivalent to a mean of 2044 admissions per year. The total cost for these admissions was £16,244,286 over 4 years, with a mean annual cost of £4,061,071. Female patients accounted for 5075 (62%) of these admissions. Of the 3870 patients with secondary OI diagnoses, the 2465 (64%) female patients had a mean 2.1 admissions per patient per year and the 1405 (36%) male patients had a mean 2.2 admissions per year (Fig. 1).
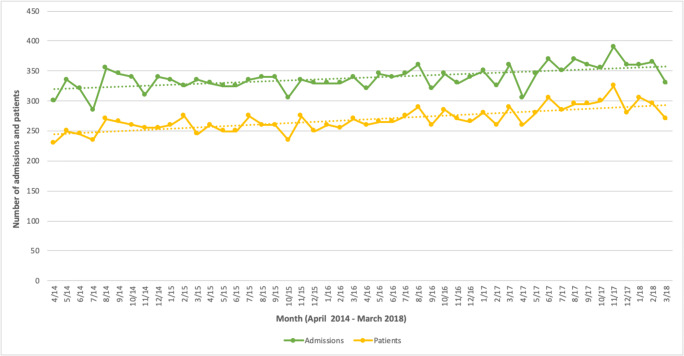
Figure 2 shows the monthly numbers of admissions and patients for primary or secondary OI diagnoses. There was a statistically significant increase of approximately 1 extra admission per month (b = 0.80, 95% CI: 0.47 to 1.15; p < 0.001) and 1 extra patient per month (b = 1.06, 95% CI: 0.78 to 1.34; p < 0.001). Over the 4 years of analysis, the number of admissions increased by an average 2.1% per year and the number of patients admitted increased by an average 6.4%.
Fig. 2.
Number of admissions and patients per month with a primary or secondary OI diagnosis (April 2014–March 2018)
Age groups
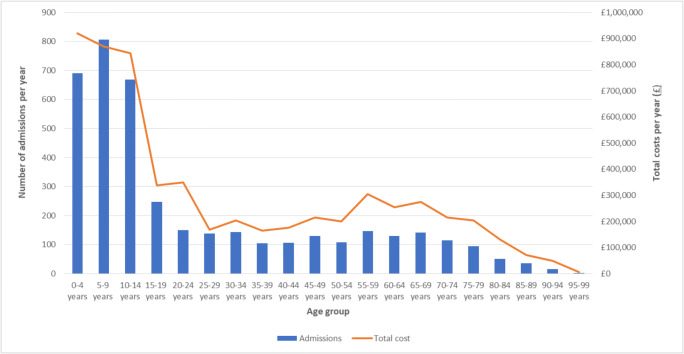
Figure 3 shows the number of admissions and estimated costs per year for either primary or secondary OI diagnoses by age group. Children aged 0 to 14 years accounted for 54% of all admissions. We found a sharp decrease in the number of admissions starting at age 15. The number of admissions then remained relatively stable for adults up to the age of 80, while only a few admissions per year were reported for adults aged over 80 years. Total costs per year followed a similar pattern across age groups. Children aged 0 to 14 years old accounted for 44% of all hospital inpatient costs. Costs decreased for young adults, slightly increased for adults aged 45 to 75, then decreased again for adults over 80.
Fig. 3.
Average number of admissions and costs per year for patients with primary or secondary OI diagnoses, reported by age group
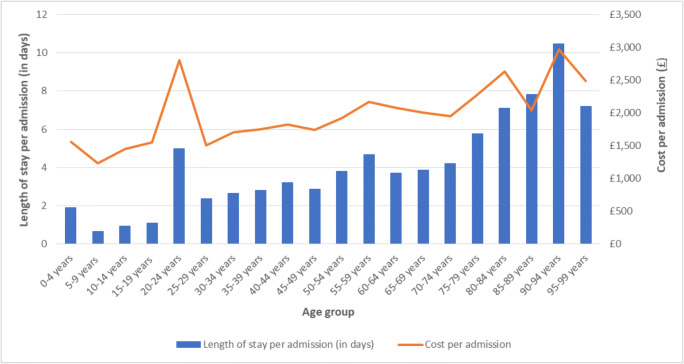
Figure 4 shows the average length of stay in days and estimated costs per admission by age group for patients with primary or secondary OI diagnoses for any admission type (day-case, regular, and ordinary). Length of stay per admission increased with age. The shortest average length of stay per admission was 0.7 days for those aged 5 to 9 years and the longest was 10.5 days for those aged 90 to 94 years. Those aged 20 to 24 years had an average length of stay per admission of 5 days, which was notably longer than that for the neighbouring age groups of 15 to 19 years (average length of stay of 1.1 days) and 25 to 29 years (average length of stay of 2.4 days).
Fig. 4.
Average length of stay and estimated cost per admission for patients with primary or secondary OI diagnoses, reported by age group. Note: Including day-case, regular, and ordinary admissions
The average total cost per admission followed a similar pattern across age groups as the length of stay. Those aged 90 to 94 had the highest average cost per admission of £2972, while those aged 5 to 9 years had the lowest of £1228.
Methods of admission
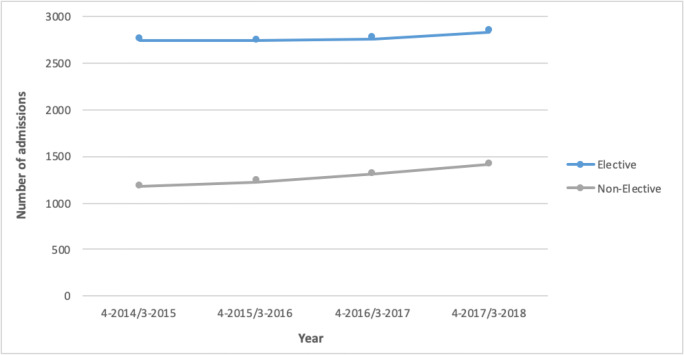
Figure 5 compares the number of elective and non-elective admissions per year for any OI diagnosis. There were 11,115 elective and 5130 non-elective admissions over the 4 years of analysis, equivalent to a mean of 2779 elective and 1283 non-elective admissions per year. Elective admissions cost an estimated £12,267,721, or £3,066,930 per year. Non-elective admissions cost an estimated £11,784,729, or £2,946,182 per year. The average cost for an elective admission was £1260 with an average waiting time of 96 days from referral to admission. The average cost for non-elective admissions was £2529 and the mean length of stay 5.9 days. Of the 16,245 admissions, 48% were day-cases, 50% ordinary cases, and 2% regular attenders. The average yearly increase in number of admissions was 0.7% for elective admissions and 5.1% for non-elective admissions.
Fig. 5.
Number of elective and non-elective admissions per year for patients with primary or secondary OI diagnoses
Procedures
Primary OI diagnosis
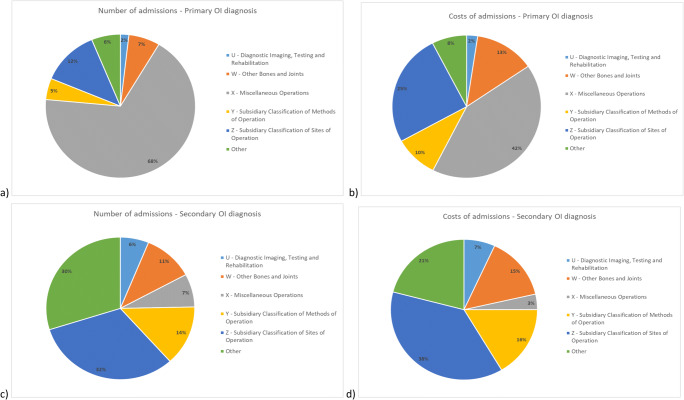
As shown in Fig. 6a, most of the admissions (68%) for patients with a primary OI diagnosis were for a primary procedure classified under chapter X of the classification system, “Miscellaneous Operations”. The next most common procedure chapter, accounting for 12% of admissions, was Z, “Subsidiary Classification of Sites of Operation”. Chapter Z codes are typically used to enhance codes from other chapters by adding information about an operation site or laterality.
Fig. 6.
Admissions of patients with OI, April 2014 through March 2018. Main procedures classified by NHS OPCS code chapter for number of admissions for patients with a primary OI diagnosis (a), cost of admissions for patients with a primary OI diagnosis (b), number of admissions for patients with a secondary OI diagnosis (c), and cost of admissions for patients with a secondary OI diagnosis (d)
The procedure responsible for the most admissions (63%) for patients with primary OI diagnosis was “administration of therapeutic substance, including injection, oral, and intravenous administration”, which we identified by searching OPCS procedure codes and descriptions. Of these, 99.7% were procedures included in chapter X (Miscellaneous Operations) and the rest chapter W (Other Bones and Joints).
Chapter X codes (Miscellaneous Operations) accounted for 42% of all costs associated with admissions with primary OI diagnoses. Chapter Z procedure codes (Subsidiary Classification of Sites of Operation) accounted for 25% of costs and chapter W codes (Other Bones and Joints) 13% of costs (Fig. 6b). Thirty-nine percent of all costs were associated with the administration of therapeutic substances.
Secondary OI diagnosis
In the case of admissions for which OI was a secondary diagnosis, 32% reported primary procedures classified under chapter Z (Subsidiary Classification of Sites of Operation), 14% under chapter Y (Subsidiary Classification of Methods of Operation), and 11% under chapter W (Other Bones and Joints) (Fig. 6c). The main procedure driving admissions was diagnostic radiology, which accounted for 11% of admissions. OPCS procedure codes were used to identify admissions whose primary procedure was diagnostic radiology, such as Y98.1 “Radiology of one body area”.
Most of the costs for admissions of patients with secondary OI diagnoses were split between chapter Z (Subsidiary Classification of Sites of Operation; 38%), chapter Y (Subsidiary Classification of Methods of Operation; 16%), and chapter W (Other Bones and Joints; 15%) codes (Fig. 6d). Thirteen percent of the total estimated costs were associated with diagnostic radiology.
Discussion
The aim of this study was to characterise hospital use by patients with OI in the English NHS. We found that the NHS provided an average 4061 hospital admissions to patients with OI each year, with an average annual cost of £6,013,113 over the 4-year study period. Although there were more female than male patients, male patients were admitted more often each year. Children younger than 14 years accounted for the highest proportion of all admissions and costs, while adults over 80 years had longer average lengths of stay and higher costs per admission than other age groups. Non-elective admissions were on average twice as expensive as elective admissions. Admissions and costs were mainly driven by procedures related to administration of therapeutic substance for patients with primary OI diagnoses and by diagnostic radiology for patients with secondary OI diagnoses. Total numbers of patients and admissions increased each year between April 2014 and March 2018.
The health needs of people with OI differ between individuals and with time of life. This variability contributes to the wide variation in the number of health providers that patients of different age groups see in the US setting [15]. We found important differences in the number and cost of admissions for each age group. Children aged 0 to 14 years accounted for the highest proportion of admissions (54%) and costs (44%) of any age group. Younger adults had considerably fewer admissions than children. Admission numbers remained stable over most of adulthood, until the age of 80 years, at which point they decreased further. This pattern of admissions likely reflects the use of intravenous bisphosphonates administered in a hospital setting as the standard of care for moderate to severe OI in children [16–18]. There is limited evidence that adults receive this treatment as widely [19, 20]. Young adults aged 20 to 24 had longer stays and higher costs than their nearest age-group neighbours, which could have been due to outliers. However, we could not examine this further in the absence of patient-level data.
Surgical interventions are used to treat fractures, prevent or correct long-bone deformities, and reduce fracture frequency in people with OI [21]. The average length of stay and cost per admission was higher for older age groups, with the longest length of stay being 10.5 days for those aged 90 to 94 years. However, only a very small number of admissions were reported for this age group. The longer stays may mirror the slower rehabilitation time for fractures as people age. Longer stays are also an indication of the increased, complex healthcare needs of older patients with OI, which should be considered when they are admitted to hospital. If hospitals are more prepared to treat these patients, the patients’ experience may improve and, if the care given is more effective as a result, the healthcare system may also reduce costs.
Female patients accounted for a higher proportion of all admissions than male patients (55% vs 45%) during the 4 years of analysis. This discrepancy was driven by the higher number of female patients and by admissions where OI was a secondary diagnosis. This result agrees with some previous studies finding that female patients were more prone to skeletal deformities, such as scoliosis, than male patients [22]. However, other studies have shown that there is considerable variability between patients with OI, even between those with the same gene mutation that cannot be attributed to their sex [23, 24]. Female and male patients with OI may have different patterns of healthcare utilisation. Further research using patient-level data is needed to explore these possible patterns.
Patients with OI had on average more admissions per year (3.3 for female patients and 4.4 for male patients) than the average NHS patient, who had 0.7 hospital admissions per year during the same period [25]. Similarly, average patients with OI had more expensive admissions (£1260 per elective admission and £2529 per non-elective admissions) than average NHS patients (£1205 per admission) [25]. The average yearly increase in elective admissions was, however, similar for patients with OI (0.8%) and the whole NHS (0.9%, between 2017/2018 and 2018/2019) [26]. The yearly average increase in non-elective admissions was higher for patients with OI (5.1%) than the whole NHS (3.7%, average between 2015 and 2019) [27]. Although non-elective admissions of patients with OI were less common than elective admissions, they were still prevalent and very costly. Non-elective admissions may therefore be an area for future research to improve care for patients with OI. For instance, better monitoring of patients and work to prevent accidents that lead to non-elective admissions, such as fractures caused from falls, may help to avoid non-elective re-admissions.
We identified 4370 patients who had at least one inpatient hospital admission during the 4 years of analysis. According to the Brittle Bone Society, around 5000 people in the UK are living with OI [28]. If these prevalence figures are accurate, only 13% of all people with OI in the UK did not need hospital care over 4 years. That the vast majority of these individuals required hospital care within a relatively short period is an indication of the increased healthcare needs of patients with OI.
Most admissions with OI as a primary diagnosis were primarily for administration of a therapeutic substance. This likely reflects the common administration of bisphosphonates to patients with OI [18]. This finding also presents an opportunity for improving the care pathway for patients with OI. A more flexible approach for providing treatments in settings outside hospitals, where possible, could reduce the burden on patients, for instance for travel. It could also reduce the burden for hospitals by freeing up limited hospital space and reducing the number of hospital appointments needed.
Diagnostic radiology procedures drove the number and costs of admissions with OI as a secondary diagnosis. The classification of procedures by OPCS chapters was not very informative, with most admissions classified under chapters that hamper understanding of the treatment provided. Future studies with access to patient-level data should further explore the procedures that take place in each admission, which we could not do with aggregated data.
The management of OI is mainly supportive and focuses on treating the symptoms of the disease. Nevertheless, new treatment strategies are currently under study, including denosumab, teriparatide, sclerostin antibodies, and TGFβ inhibitory antibodies [29]. Novel therapies may improve the treatment of OI and reduce the need for and duration of hospital admissions. Alongside clinical effectiveness, the cost-effectiveness of new therapies should be considered to determine whether they reduce the economic burden caused by OI.
Strengths and limitations
This study has some limitations. Only “core” HRG codes and excess length of stay were considered when estimating costs. These costs typically capture the bulk of hospital admission costs, but the exclusion of “unbundled” HRGs does result in underestimated total costs.
We had access to inpatient admitted patient care data, but not emergency or outpatient hospital contacts. As patients with OI have an increased risk of fractures, emergency and outpatient admissions are relevant to their healthcare use [19]. We could only describe the reason for hospitalisation admissions at a high level, and the procedure codes available were often not detailed enough to identify the specific intervention undertaken. Access to patient-level data and secondary OPCS codes could provide more in-depth information on the reason and content of each admission. We were not able to perform case validation to confirm whether the ICD-10 codes used effectively captured all admissions of patients with OI. Although we identified the codes based on expert clinical opinion and are confident that they identified most relevant admissions, future studies validating these codes are recommended.
This study also has strengths. This is one of the first studies describing the hospital use of patient with OI using routinely collected, real-world data from all NHS-funded hospital admissions in England. Even though OI is a rare disease, using HES data allowed us to analyse all OI-coded admissions anywhere in England paid for by the NHS during 4 financial years. The breadth of our analysis thus offers a detailed picture of inpatient hospital healthcare use and costs for patients with OI, which was not previously available.
Conclusion
The results from this paper highlight the considerable volume of NHS resources currently used to manage patients with OI. This burden could be reduced by reducing non-elective admissions and providing treatment to patients with OI in non-hospital settings. Further research based on patient-level data is needed to better understand the natural history of the disease and its economic burden on the healthcare system so that better decisions can be made to support patients living with OI.
Acknowledgements
We acknowledge English language editing by Dr Jennifer A de Beyer of the Centre for Statistics in Medicine, University of Oxford.
Funding
This analysis was funded by a research grant from the Brittle Bone Society (BBS). The funder played no role in the design or conduct of the study.
Data availability
The authors do not have permission to share the data.
Compliance with ethical standards
Conflicts of interest
RPV has received research funding from Kyowa Kirin Services and lecture fees and/or consulting honoraria from Amgen, UCB, Kyowa Kirin Services, and Mereo Biopharma. MKJ has received consultancy fees from Mereo Biopharma. SK declares no conflict of interest.
Code availability
Descriptive statistics were calculated using Excel.
Footnotes
Publisher’s note
Springer Nature remains neutral with regard to jurisdictional claims in published maps and institutional affiliations.
References
- 1.Van Dijk FS, Sillence DO. Osteogenesis imperfecta: clinical diagnosis, nomenclature and severity assessment. Am J Med Genet A. 2014;164a(6):1470–1481. doi: 10.1002/ajmg.a.36545. [DOI] [PMC free article] [PubMed] [Google Scholar]
- 2.Lim J, Grafe I, Alexander S, Lee B. Genetic causes and mechanisms of osteogenesis imperfecta. Bone. 2017;102:40–49. doi: 10.1016/j.bone.2017.02.004. [DOI] [PMC free article] [PubMed] [Google Scholar]
- 3.Song Y, Zhao D, Li L, Lv F, Wang O, Jiang Y, Xia W, Xing X, Li M. Health-related quality of life in children with osteogenesis imperfecta: a large-sample study. Osteoporos Int. 2019;30(2):461–468. doi: 10.1007/s00198-018-4801-5. [DOI] [PubMed] [Google Scholar]
- 4.Vanz AP, van de Sande Lee J, Pinheiro B, Zambrano M, Brizola E, da Rocha NS, Schwartz IVD, de Souza Pires MM, Felix TM. Health-related quality of life of children and adolescents with osteogenesis imperfecta: a cross-sectional study using PedsQL. BMC Pediatr. 2018;18(1):95. doi: 10.1186/s12887-018-1077-z. [DOI] [PMC free article] [PubMed] [Google Scholar]
- 5.Hald JD, Folkestad L, Harslof T, Brixen K, Langdahl B. Health-related quality of life in adults with osteogenesis imperfecta. Calcif Tissue Int. 2017;101(5):473–478. doi: 10.1007/s00223-017-0301-4. [DOI] [PubMed] [Google Scholar]
- 6.Matsushita M, Mishima K, Yamashita S, Haga N, Fujiwara S, Ozono K, Kubota T, Kitaoka T, Ishiguro N, Kitoh H. Impact of fracture characteristics and disease-specific complications on health-related quality of life in osteogenesis imperfecta. J Bone Miner Metab. 2020;38(1):109–116. doi: 10.1007/s00774-019-01033-9. [DOI] [PubMed] [Google Scholar]
- 7.Forestier-Zhang L, Watts L, Turner A, Teare H, Kaye J, Barrett J, Cooper C, Eastell R, Wordsworth P, Javaid MK, Pinedo-Villanueva R. Health-related quality of life and a cost-utility simulation of adults in the UK with osteogenesis imperfecta, X-linked hypophosphatemia and fibrous dysplasia. Orphanet J Rare Dis. 2016;11(1):160. doi: 10.1186/s13023-016-0538-4. [DOI] [PMC free article] [PubMed] [Google Scholar]
- 8.Forlino A, Cabral WA, Barnes AM, Marini JC. New perspectives on osteogenesis imperfecta. Nat Rev Endocrinol. 2011;7:540. doi: 10.1038/nrendo.2011.81. [DOI] [PMC free article] [PubMed] [Google Scholar]
- 9.Herbert A, Wijlaars L, Zylbersztejn A, Cromwell D, Hardelid P. Data resource profile: Hospital Episode Statistics Admitted Patient Care (HES APC) Int J Epidemiol. 2017;46(4):1093–1093i. doi: 10.1093/ije/dyx015. [DOI] [PMC free article] [PubMed] [Google Scholar]
- 10.Health and Social Care Information Centre Hospital Episode Statistics. https://digital.nhs.uk/data-and-information/data-tools-and-services/data-services/hospital-episode-statistics. Accessed June 2020
- 11.NHS England (2016) Supplementary technical definitions 2016/17: Activity
- 12.Health and Social Care Information Centre (2018) HES data dictionary: admitted patient care
- 13.The National Casemix Classifications Service (2009) Guide to unbundling
- 14.Clinical Classifications Service (2017) National clinical coding standards OPCS-4. Health and Social Care Information Centre
- 15.Tosi LL, Oetgen ME, Floor MK, Huber MB, Kennelly AM, McCarter RJ, Rak MF, Simmonds BJ, Simpson MD, Tucker CA, McKiernan FE. Initial report of the osteogenesis imperfecta adult natural history initiative. Orphanet J Rare Dis. 2015;10:146. doi: 10.1186/s13023-015-0362-2. [DOI] [PMC free article] [PubMed] [Google Scholar]
- 16.Land C, Rauch F, Travers R, Glorieux FH. Osteogenesis imperfecta type VI in childhood and adolescence: effects of cyclical intravenous pamidronate treatment. Bone. 2007;40(3):638–644. doi: 10.1016/j.bone.2006.10.010. [DOI] [PubMed] [Google Scholar]
- 17.Glorieux FH, Bishop NJ, Plotkin H, Chabot G, Lanoue G, Travers R. Cyclic administration of pamidronate in children with severe osteogenesis imperfecta. N Engl J Med. 1998;339(14):947–952. doi: 10.1056/nejm199810013391402. [DOI] [PubMed] [Google Scholar]
- 18.Dwan K, Phillipi CA, Steiner RD, Basel D (2016) Bisphosphonate therapy for osteogenesis imperfecta. The Cochrane Library [DOI] [PMC free article] [PubMed]
- 19.Folkestad L, Hald JD, Ersboll AK, Gram J, Hermann AP, Langdahl B, Abrahamsen B, Brixen K. Fracture rates and fracture sites in patients with osteogenesis imperfecta: a nationwide register-based cohort study. J Bone Miner Res. 2017;32(1):125–134. doi: 10.1002/jbmr.2920. [DOI] [PubMed] [Google Scholar]
- 20.Hald JD, Evangelou E, Langdahl BL, Ralston SH. Bisphosphonates for the prevention of fractures in osteogenesis imperfecta: meta-analysis of placebo-controlled trials. J Bone Miner Res. 2015;30(5):929–933. doi: 10.1002/jbmr.2410. [DOI] [PubMed] [Google Scholar]
- 21.Monti E, Mottes M, Fraschini P, Brunelli P, Forlino A, Venturi G, Doro F, Perlini S, Cavarzere P, Antoniazzi F. Current and emerging treatments for the management of osteogenesis imperfecta. Ther Clin Risk Manag. 2010;6:367–381. doi: 10.2147/tcrm.s5932. [DOI] [PMC free article] [PubMed] [Google Scholar]
- 22.Cao YJ, Wei Z, Zhang H, Zhang ZL. Expanding the clinical spectrum of osteogenesis imperfecta type V: 13 additional patients and review. Front Endocrinol. 2019;10:375. doi: 10.3389/fendo.2019.00375. [DOI] [PMC free article] [PubMed] [Google Scholar]
- 23.Shapiro JR, Lietman C, Grover M, Lu JT, Nagamani SC, Dawson BC, Baldridge DM, Bainbridge MN, Cohn DH, Blazo M, Roberts TT, Brennen FS, Wu Y, Gibbs RA, Melvin P, Campeau PM, Lee BH. Phenotypic variability of osteogenesis imperfecta type V caused by an IFITM5 mutation. J Bone Miner Res. 2013;28(7):1523–1530. doi: 10.1002/jbmr.1891. [DOI] [PMC free article] [PubMed] [Google Scholar]
- 24.Rauch F, Moffatt P, Cheung M, Roughley P, Lalic L, Lund AM, Ramirez N, Fahiminiya S, Majewski J, Glorieux FH. Osteogenesis imperfecta type V: marked phenotypic variability despite the presence of the IFITM5 c.-14C>T mutation in all patients. J Med Genet. 2013;50(1):21–24. doi: 10.1136/jmedgenet-2012-101307. [DOI] [PubMed] [Google Scholar]
- 25.Kolovos S, Nador G, Kishore B, Streetly M, Rabin NK, Chantry AD, Yong K, Ashcroft J, Bowcock S, Drayson MT, Ramasamy K, Prieto-Alhambra D, Cooper C, Javaid MK, Pinedo-Villanueva R. Unplanned admissions for patients with myeloma in the UK: low frequency but high costs. J Bone Oncol. 2019;17:100243. doi: 10.1016/j.jbo.2019.100243. [DOI] [PMC free article] [PubMed] [Google Scholar]
- 26.NHS England (2019) NHS inpatient admission and outpatient referrals and attendances 1edn
- 27.Baker C (2020) NHS key statistics: England
- 28.Brittle Bone Society (2020) What is osteogenesis imperfecta? https://brittlebone.org/what-is-oi/about-oi/. Accessed 27 Aug 2020
- 29.Marom R, Rabenhorst BM, Morello R. Osteogenesis imperfecta: an update on clinical features and therapies. Eur J Endocrinol. 2020;183(4):R95–R106. doi: 10.1530/EJE-20-0299. [DOI] [PMC free article] [PubMed] [Google Scholar]
Associated Data
This section collects any data citations, data availability statements, or supplementary materials included in this article.
Data Availability Statement
The authors do not have permission to share the data.


