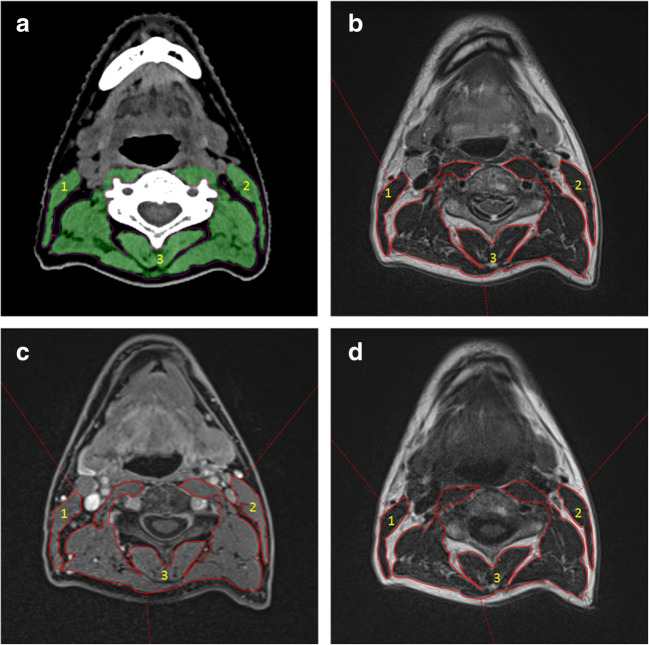
Fig. 2.
Skeletal muscle measurements at the level of C3 on axial neck CT and MRI images. (1) CSA of the right sternocleidomastoids muscle, (2) CSA of the left sternocleidomastoids muscle, and (3) CSA of the paravertebral muscles. a Acquired using CT. The green area represents the delineated muscle area which corresponds with the preset Hounsfield units range of − 29 until 150. Other densities are automatically excluded from the measured area. b–d Slices acquired using 1.5-T MRI. The before-mentioned muscles are delineated red with (b) T2 without fat suppression, (c) T1 with contrast and fat suppression, and (d) being T1 sequence without contrast and without fat suppression. C3 third cervical vertebra, CT computed tomography, MRI magnetic resonance imaging, CSA cross-sectional area

