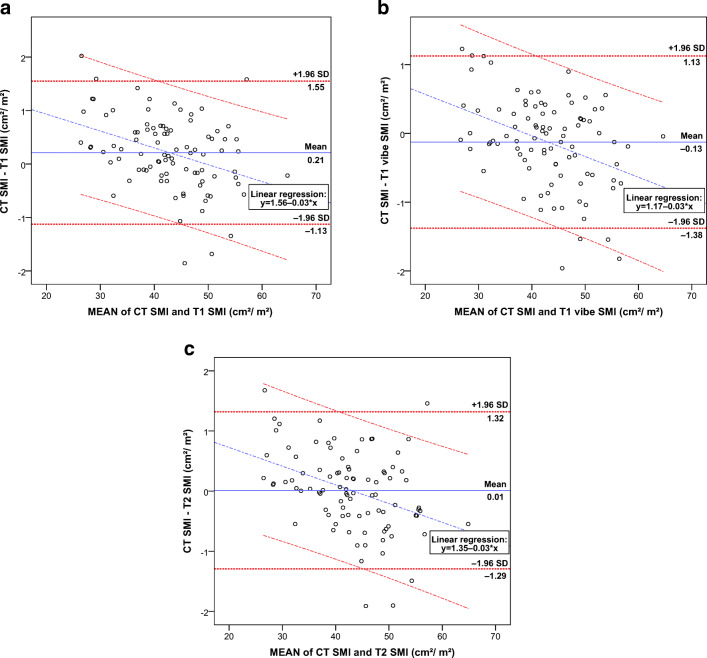
Fig. 3.
Bland–Altman plots with mean SMI and ΔSMI between CT and 1.5-T MRI. Boundaries with the 95% confidence interval (± 1.96 times the standard deviation) are given for the mean ΔSMI and linear regression analysis. For all patients with a 1.5-T MRI (n = 92) comparing CT SMI versus T1 SMI (a), CT SMI versus T1 vibe SMI (b), and CT SMI versus T2 SMI (c). SMI skeletal muscle index, CT computed tomography, MRI magnetic resonance imaging

