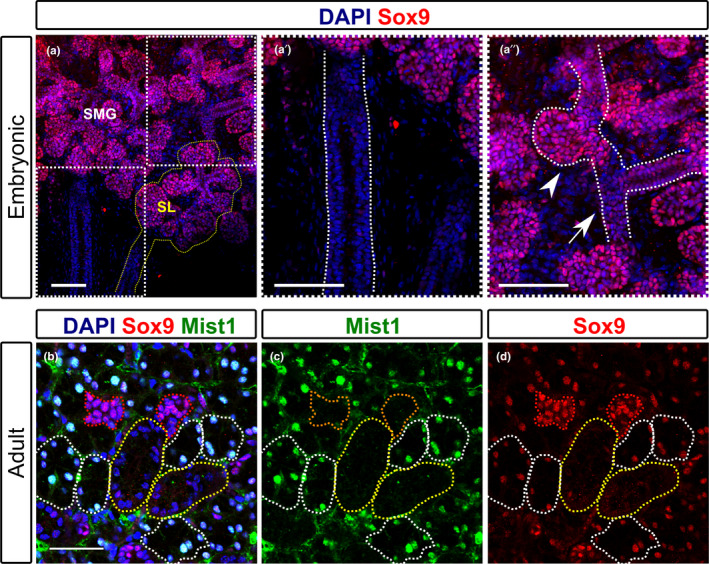
FIGURE 1.

Sox9 expression in embryonic and adult submandibular glands. (a–a″) Immunofluorescence of Sox9 (pink) in the embryonic E15.5 submandibular glands. (a) The adjacent embryonic sublingual gland (outlined in dashed yellow), which displays a similar pattern of expression to the submandibular gland. Dotted boxes in (a) indicate the area magnified in a′ and a′. (a′) Submandibular gland main duct, outlined by dotted white lines. (a″) Arrow head indicates forming acini with high levels of Sox9 expression. Arrow indicated forming intercalated duct with lower levels of Sox9. (b–d) Immunofluorescence of Sox9 (pink) and Mist1 (green) in the adult submandibular gland during homeostasis (female mouse 6–10 weeks). DNA is shown in blue (DAPI). (b) DAPI, Sox9, Mist1. Red dotted lines outline small intercalated ducts. White dotted lines outline acini. Yellow dotted lines outline larger striated/granular ducts. (c) Nuclear Mist1 highlights acini cells. (d) Sox9 is highest in Mist1‐negative intercalated ducts. SMG, submandibular gland; SL; sublingual gland. Scale bars: 100 μm (a‐a″); 50 μm (b–d)
