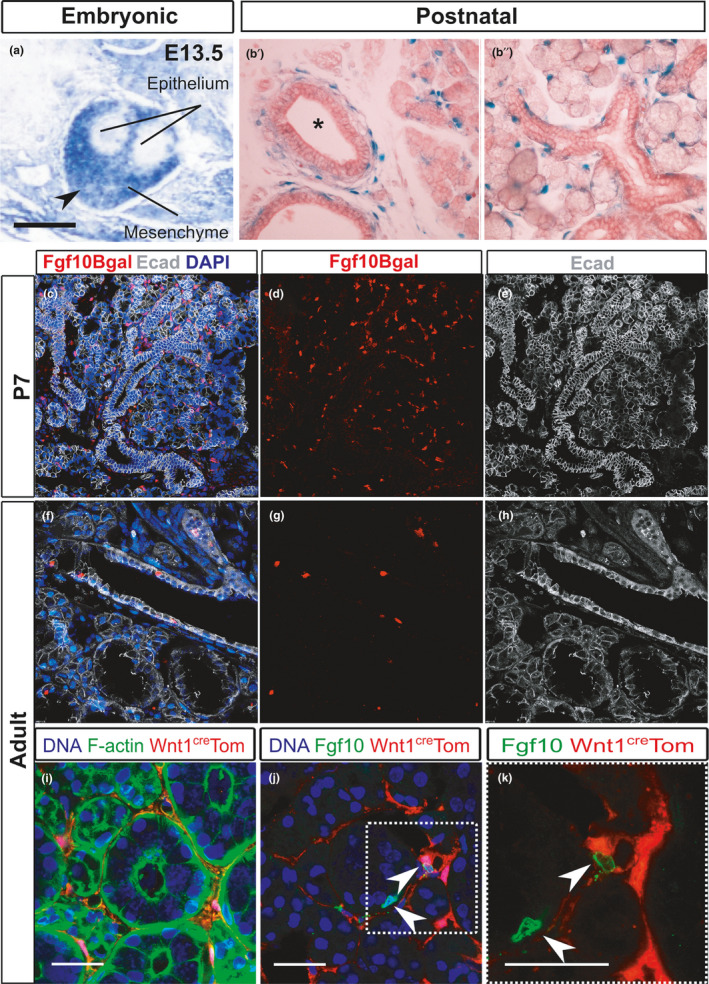
FIGURE 2.

Fgf10 expression in the embryonic and adult submandibular glands. (a) In situ hybridisation for Fgf10 in the embryonic submandibular gland at E13.5. Arrowhead points to expression in the gland capsule. (b′–b″) LacZ staining (blue) of postnatal Fgf10LacZ mice 7 days after birth when the glands are still growing. Gland counterstained with eosin. (b′) Main excretory duct (asterisk) surrounded by positive cells. (b″) Forming striated ducts and acini are surrounded by positive cells in the adjacent mesenchyme. (c–e) Postnatal day 7. Immunofluorescence against B‐galactosidase (red), E‐cadherin (white), DAPI (blue). (c) Combined image showing Fgf10 cells in the mesenchyme. (d) Fgf10‐positive cells. (e) Gland morphology shown using E‐cadherin to outline the epithelium. (f–h) Adult male submandibular gland. Immunofluorescence against Bgal (red), Ecadherin (white) and DAPI (blue). (f) Combined image showing Fgf10‐positive cells in the gland epithelial ducts. (g) Fgf10‐positive cells. (h) Gland morphology shown using E‐cadherin to outline the epithelium. (i–k) Submandibular glands from adult female Wnt1cre;R26Tom mice. (i) Immunofluorescence for RFP (red) and F‐actin (green) to outline the gland structure. DNA is shown in blue (DAPI). Red cells are, as expected, located in the gland mesenchyme which is restricted in the adult. (j) Immunofluorescence against Fgf10 protein (green). Arrowheads highlight that Fgf10‐positive cells (green) do not overlap with the neural crest‐derived cells (red). Dotted box in j shown in (k). (k) Nonoverlap between Wnt1creTom and Fgf10. Scale bars i‐k: 25 µm
