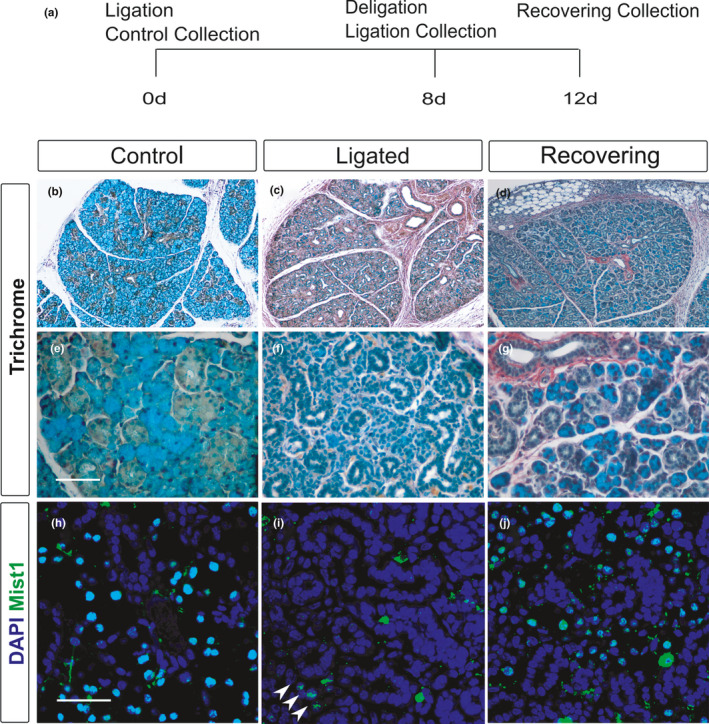
FIGURE 3.

Degeneration of acinar cells after ligation and regeneration after deligation. (a) Experimental strategy to study submandibular gland regeneration after duct ligation. (b–g) Trichrome staining of an unoperated (b, e), ligated (c, f) and regenerating (d, g) submandibular gland. All mice were female 6–10 weeks old. (h–j) Immunofluorescence for the acinar cell marker Mist1 (green: nuclear stain) in an unoperated (h), ligated (i) and regenerating (j) submandibular gland. DNA is shown in blue (DAPI). Arrowheads in (i) indicate a few resistant acinar cells after ligation. Scale bars (e) and (h): 50 μm. Same scale in f,g,i,j
