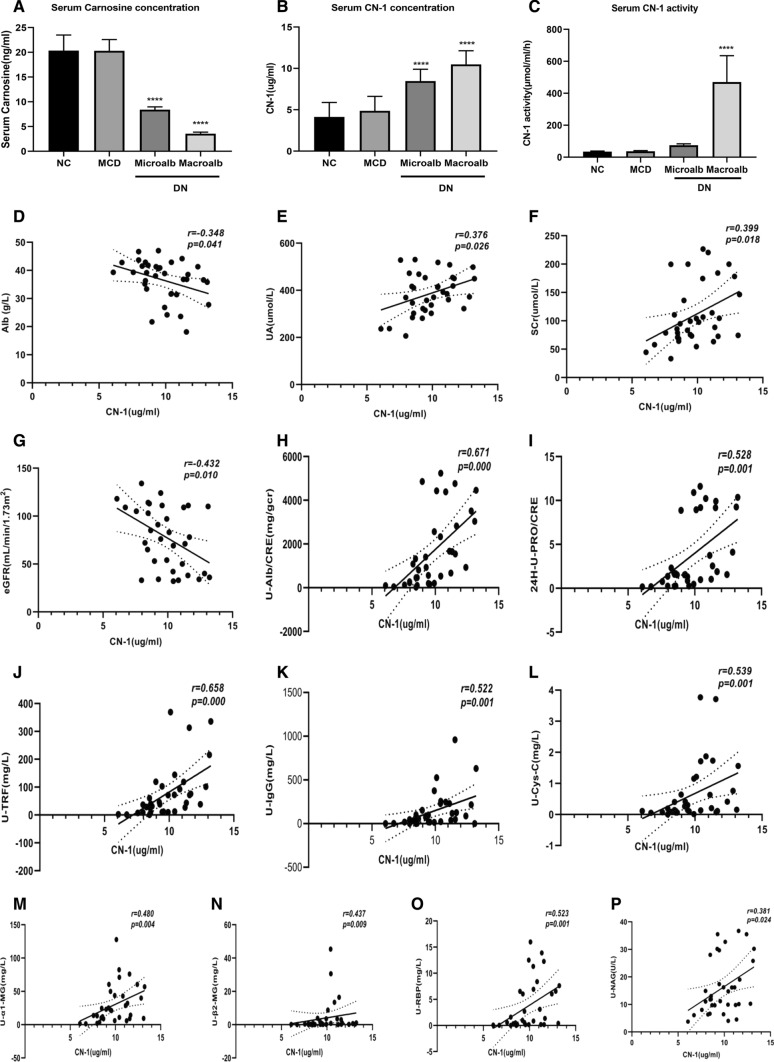
Fig. 1.
Serum carnosine and CN-1 concentration, and its relationship with clinical indicators. The serum carnosine concentration was detected by UPLC (a). The serum CN-1 concentration and activity were detected by ELISA method (b, c). Correlations between serum CN-1 concentration with Alb (d), UA (e), SCr (f), eGRF (g), U-Alb/CRE (h), 24 h-U-PRO/CRE (i), U-TRF (j), U-IgG (k), U-Cys-C (l), U- α1-MG (m), U-β2-MG (n), U-NAG (o), U-RBP (p) in DN group. TRF transferrin, RBP retinol-binding protein, NAG N-acetyl-glycosaminidase, IgG Immunoglobulin G, FDP fibrin degradation product, Cys-C cystatin C, β2-MG beta-2-microglobulin, α1-MG alpha-1-macroglobulin, Alb/CRE albumin-to-creatinine ratio. *p < 0.05; **p < 0.01; ***p < 0.001; ****p < 0.0001

