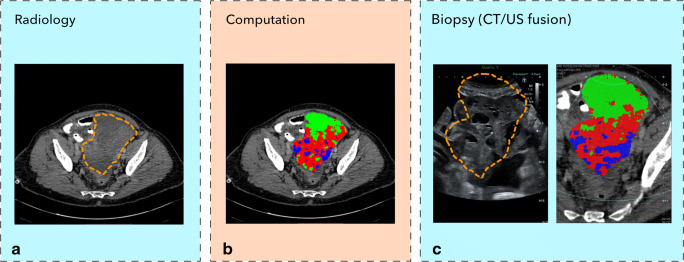
Fig. 2.
Illustration of a patient with a pelvic tumour. a Routine contrast-enhanced CT images were used to manually segment the pelvic tumour (dashed line). b Spatial radiomic feature extraction and generation of habitat maps. For this patient, three tumour habitats are feasible and highlighted in blue, red, and green, respectively. c The left figure shows the US image with the co-registered CT-based tumour segmentation (dashed line). The right figure shows the CT scan overlaying the US plane, with the habitat maps highlighted in colour. The US images correspond to a different plane orientation with respect to panels a and b

