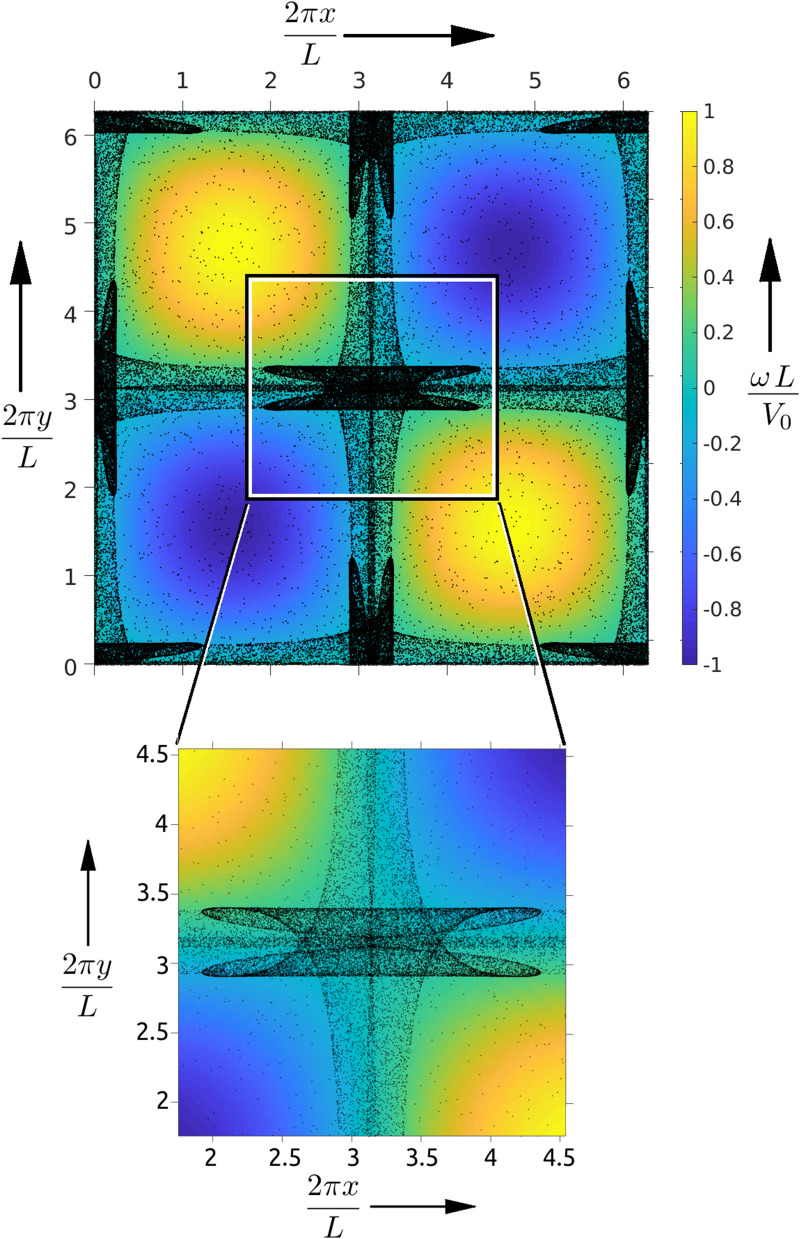
Figure 1.
A snapshot of the 2D spatial particle distribution in (a) at shows the complex structure formed by the mono-dispersed inertial particles with in a periodic domain of size . The background color-map corresponds to the vorticity field (with values given by the colorbar on the left side of the top panel) and the particles are plotted using black markers. Notice that the particles in the high vorticity regions have moved out towards the regions bounding the vortices. The zoomed-in version in (b) shows the details of the caustic structures around the central region of the domain. See the video C.1 for the evolution of the caustic structures. The figures were generated using Matlab 2020a, https://www.mathworks.com/products/matlab.html.

