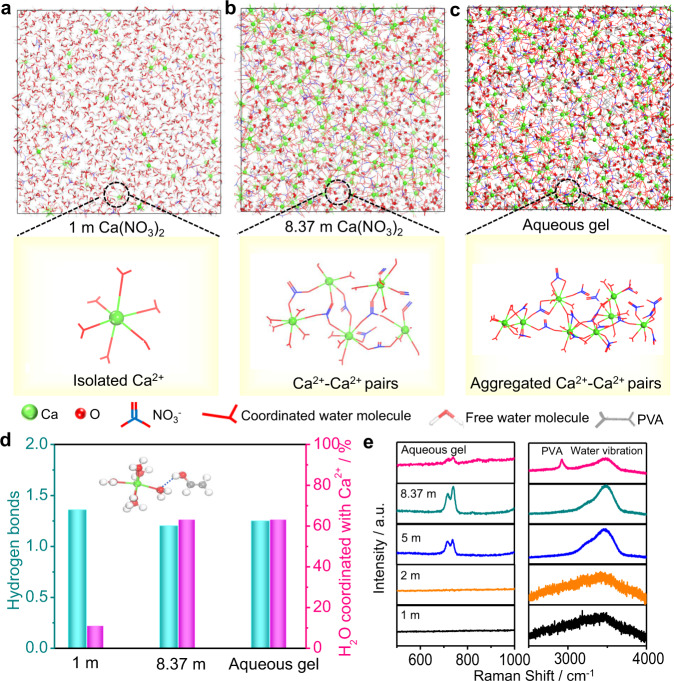
Fig. 2. Molecular dynamics simulations and characterization of electrolytes.
Snapshots of local structure evolution for a 1 m Ca(NO3)2 electrolyte, b saturated Ca(NO3)2 electrolyte, and c aqueous gel electrolyte based on MD simulation at 10 ns. d The hydrogen bonds and the percentage of water molecular coordinated with Ca2+ for three electrolyte samples based on MD simulation at 10 ns. The hydrogen bond between the Ca2+–H2O complex and PVA repetitive unit is shown in the inset. The green, red, white, and gray balls represent Ca, O, H, and C, respectively. e Raman spectra of the 1 m, 2 m, 5 m and saturated Ca(NO3)2 aqueous electrolytes, and aqueous gel electrolyte.

