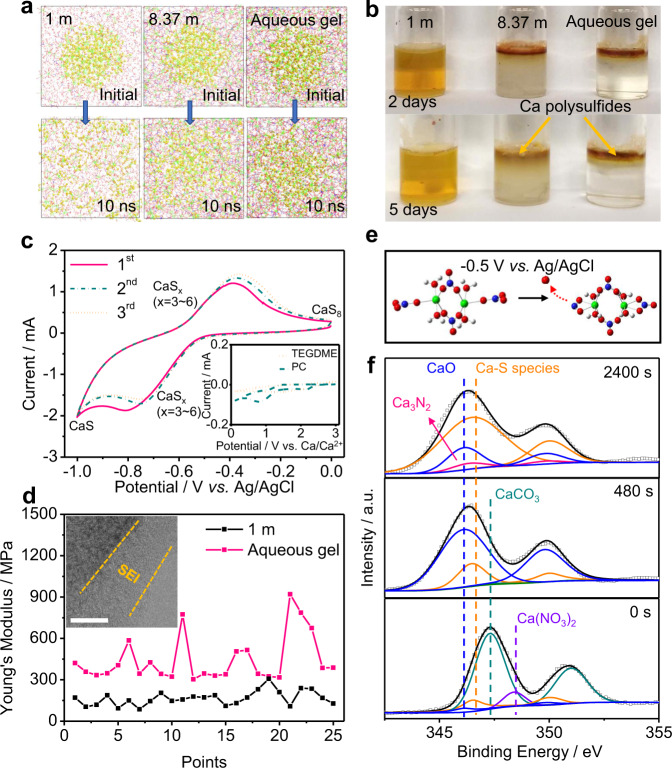
Fig. 3. Reaction mechanism of elemental sulfur in the aqueous gel electrolyte.
a Local structure evolutions of CaS4 (yellow) diffusions in 1 m, 8.37 m Ca(NO3)2 electrolytes, and aqueous gel electrolyte based on MD simulation. The yellow balls represent S atoms, and other symbols are same with those in Fig. 2a–c. b Visual observation of calcium polysulfides diffusion in 1 m, 8.37 m Ca(NO3)2 electrolyte, and gel electrolyte. c The initial CV curves of S/C electrode collected at a scan rate of 0.2 mV s–1 in the aqueous gel electrolyte. The CV curves of Ca metal||S/C cell with 0.5 m Ca(OTf)2 in TEGDME or 0.5 m Ca(OTf)2 in PC electrolytes at 0.2 mV s–1 are shown in inset of Fig. 3c. d The Young’s Modulus of S/C anodes tested in 1 m Ca(NO3)2 and aqueous gel electrolytes. The points are selected from the AFM scanning images in Supplementary Fig. 16. The inset is HADDF–STEM images of S/C anodes after cycling in aqueous gel electrolyte, scale bar: 10 nm. e The DFT calculations of reduction of Ca2+(NO3–)3(H2O)x aggregate. The green, blue, red, and white balls represent Ca, N, O, and H atoms, respectively. f In-depth Ca 2p XPS of the S/C electrode after cathodic CV scanning.

