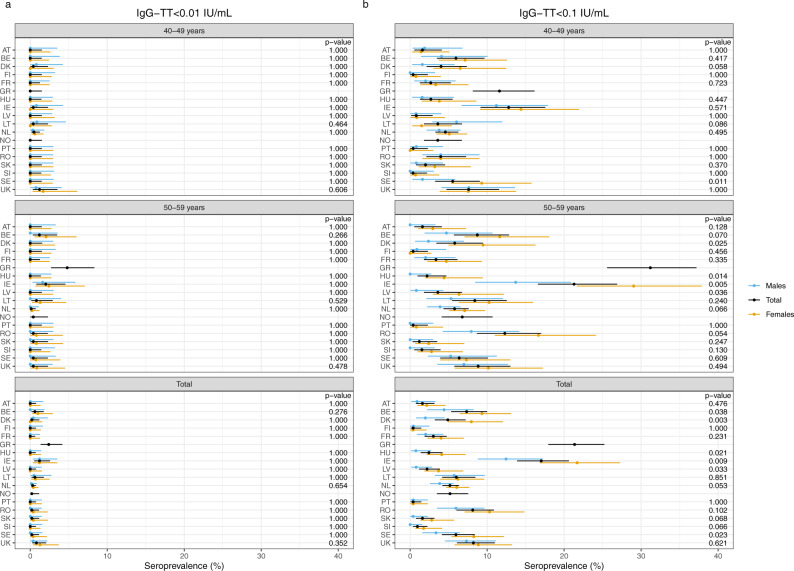
Fig. 4. Percentage of sera protected against tetanus in the two age groups (40–49 and 50–59) separately and in the total cohort, and subdivided by sex per country (Y-axis).
On the X-axis the percentage of lack of seroprotection against tetanus for IgG-TT < 0.01 IU/mL (a) and <0.1 IU/mL (b) is displayed. The dots indicate the estimated seroprevalence, the bars the corresponding 95% confidence intervals. The estimates and p values of the differences are obtained by using exact binomial methods. Abbreviations of all participating countries and the number of samples included in the study are listed in Table 1.

