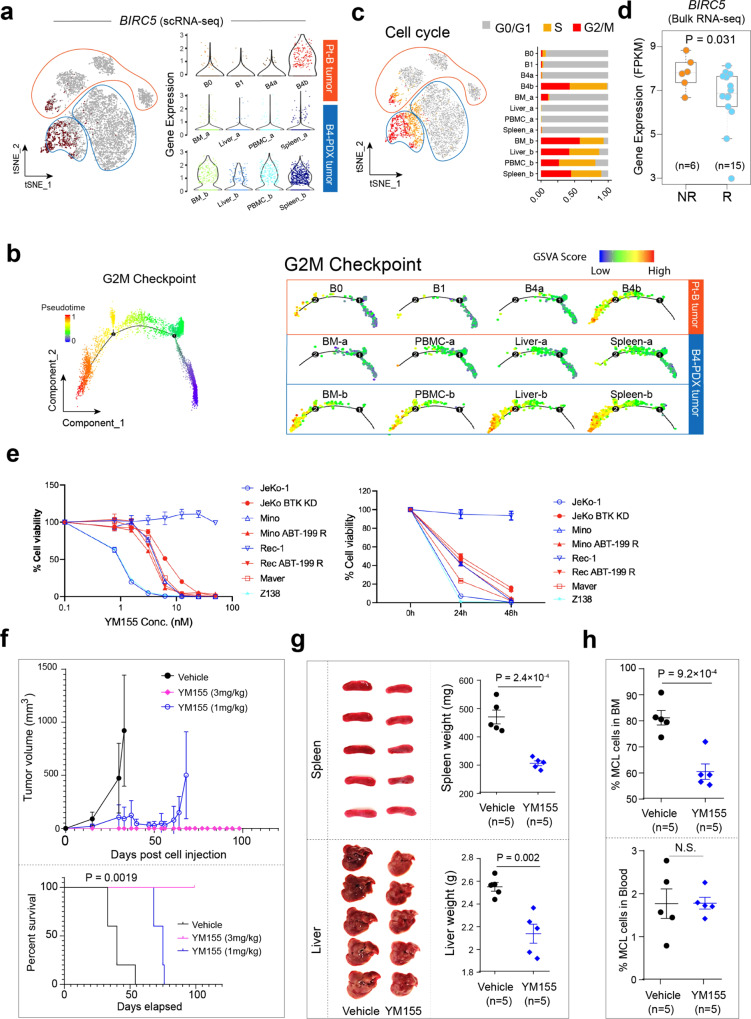
Fig. 5. Validation of key cancer hallmarks in the B4-derived PDX model and identification of survivin (BIRC5) as a target to overcome ibrutinib-venetoclax resistance.
a Feature plot of BIRC5 expression in cells from patient B tumor and B4-derived PDX tumors (same t-SNE plot as in Fig. 2D) (left). BIRC5 expression with violin plot (right). b Cells from panel A projected to a two-dimensional space by Monocle2. Each point corresponds to a single cell and cells are colored according to the inferred pseudotime (blue to red). Monocle2 was run with default parameters on the hallmark gene sets G2M Checkpoint downloaded from MSigDB. c Feature plot showing the cell cycle stage of each cell inferred by Seurat based on canonical cell cycle-related markers (left) and the relative proportion of cell cycle phase of cells from patient B tumor and B4-derived PDX tumors (right). d Differential BIRC5 expression via bulk RNA-seq comparing ibrutinib responders (n = 15) and nonresponders (n = 6) in a separate MCL patient cohort. The line in the box is the median value. The bottom and top of the box are the 25th and 75th percentiles of the sample. The bottom and top of the whiskers are the minimum and maximum values of the sample. p value corresponds to the two-sided Wilcoxon signed-rank test. e The in vitro efficacy of survivin inhibitor YM155 in MCL cell lines. YM155-induced cell toxicity in MCL cell lines (red: ibrutinib-resistant; blue: ibrutinib-sensitive) in a dose (left)- and time (right)-dependent manner. The experiments were performed in triplicate (n = 3). Error bars represent the standard deviation (SD). f Mice (n = 5 per group) were injected subcutaneously with freshly isolated B4-PDX cells and allowed for engraftment until the tumors became palpable. The mice were then treated with continuous infusion of YM155 at 0, 1.0 or 3.0 mg/kg for 28 days. Mice were sacrificed when tumor size reached 15 mm or at day 99 post cell inoculation as end point of experiment. Plots representing tumor volume (top) and survival curves (bottom) of control and YM155-treated mice. Error bars represent the standard deviation (SD). The log-rank test was used for survival analysis. g Images and weights of mouse spleens and livers from B4-PDX mice model treated with vehicle or YM155. Error bars represent the standard deviation (SD). h The proportion of MCL cells (hCD5+hCD20+) in mouse BM and PM disseminations in response to YM155 (n = 5) compared to the control vehicle (n = 5). The two-sided Student t test was used for statistical analysis in (g) and (h). Error bars represent the standard deviation (SD).

