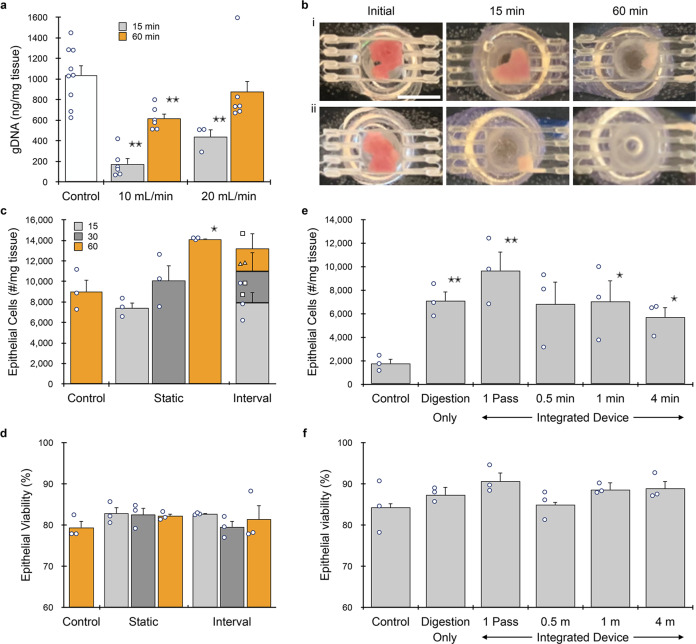
Fig. 2. Device optimization using murine kidney.
a Kidneys (n = 3 to 9 independent samples) were harvested, minced, and processed using the minced digestion device at 10 or 20 mL/min flow rate for 15 or 60 min, and total genomic DNA (gDNA) was quantified. gDNA was extracted directly from the control, and thus this represents maximum recovery. Results at 20 mL/min flow rate were superior, particularly at the shorter time point. b Pictures of tissue within the minced digestion device chamber before and after 15 or 60 min of processing at 10 (i) or 20 (ii) mL/min flow rate. Significant tissue remained at 10 mL/min, while tissue was largely absent at 20 mL/min. c Single EpCAM+ epithelial cells were quantified by flow cytometry after samples (n = 3) were processed with the minced digestion device for 15, 30, or 60 min. We also evaluated recovery of sample at different time intervals, with more collagenase added to continue processing of remaining tissue. d Epithelial cell viability was ~80% for all control and device conditions (n = 3). e Samples (n = 3) were processed with the integrated dissociation/filter device following 15 min of digestion device treatment. A single pass through the integrated device produced optimal results. f Epithelial cell viability was at ~85–90% for all conditions (n = 3). Data are presented as mean values ± SEM from at least three independent experiments. Circles indicate values for experimental replicates. For the stacked plot, experimental replicates are indicated by circles at 15 min, squares at 30 min, and triangles at 60 min. Two-sided T test was used for statistical testing. Stars indicate p < 0.05 and double stars indicate p < 0.01 relative to the control at the same digestion time. p values for all comparisons are presented in the Source Data file.

