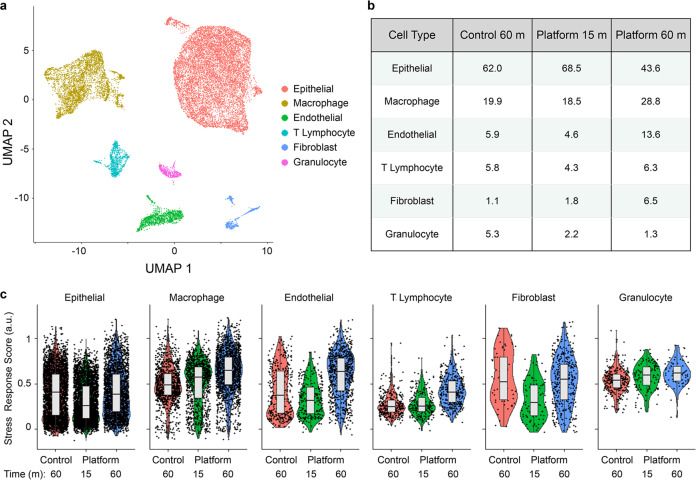
Fig. 6. scRNA-seq of murine mammary tumor (n = 1).
Cell suspensions obtained from the microfluidic platform at 15 and 60 min intervals, as well as the 60 min control, were processed and analyzed using similar methods to kidney. a UMAP displaying six cell clusters that correspond to epithelial cells, macrophages, endothelial cells, T lymphocytes, fibroblasts, and granulocytes. b Population distributions for each cell cluster and processing condition. Epithelial cells were predominantly eluted from the microfluidic platform in the 15 min interval, while endothelial cells and fibroblasts were enriched in the 60 min interval. Fibroblasts were enriched in both platform conditions, while granulocytes were depleted. c Stress response scores, displayed in violin plots, were generally similar across conditions and cell types. Horizontal line depicts median and edges of box depict 1st and 3rd quartiles.

