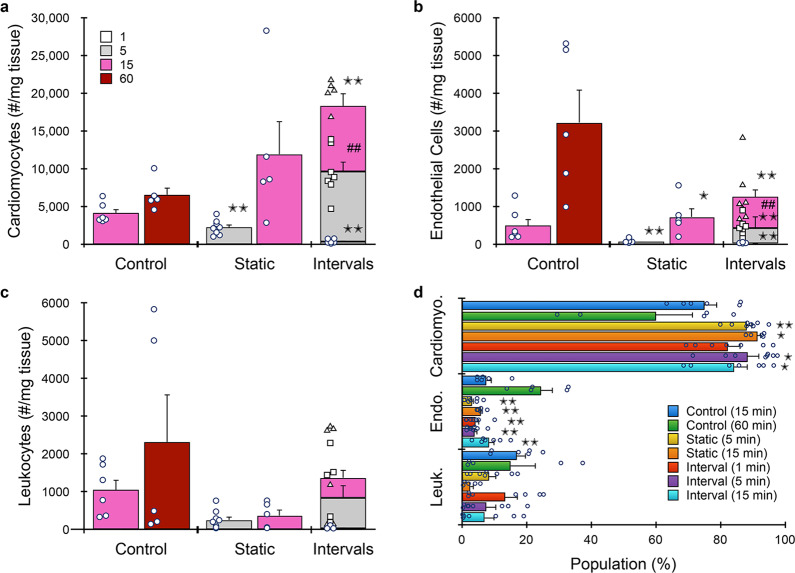
Fig. 8. Microfluidic platform results for murine heart.
Hearts (n = 5 to 8 independent samples) were resected, minced, processed with the microfluidic platform (both 50 and 15 µm membranes), and analyzed by flow cytometry. We employed shorter digestion device time points due to the sensitivity of cardiomyocytes. a Microfluidic processing produced ~12,000 cardiomyocytes per mg after 15 min, which was ~2-fold higher than the 60 min control. Interval recovery produced optimal results again, increasing by ~50% and ~3-fold relative to the 15 min static and 60 min control conditions. b Endothelial cell and c leukocyte yields were significantly lower than the 60 min control under both static and interval formats. Interval recovery did improve results, but remained ~2-fold lower than the 60 min controls. d Population distributions obtained for each processing condition. Microfluidic processing generally enriched for cardiomyocytes. Data are presented as mean values ± SEM from at least three independent experiments. Circles indicate values for experimental replicates. For stacked plots, experimental replicates are indicated by circles at 15 min, squares at 30 min, and triangles at 60 min. Two-sided T test was used for statistical testing. Stars indicate p < 0.05 and double stars indicate p < 0.01 relative to the 60 min control. Cross-hatches indicate p < 0.05 and double cross-hatches indicate p < 0.01 relative to the static condition at the same digestion time. p values for all comparisons are presented in the Source Data file.

