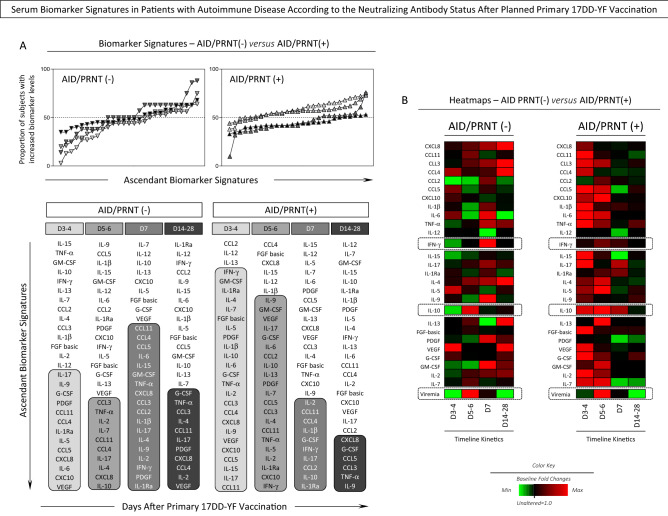
Figure 6.
Serum Biomarker Signatures in Patients with Autoimmune Disease According to the Neutralizing Antibody Status After Planned Primary 17DD-YF Vaccination. (A) Kinetics of serum biomarker signatures at distinct time points after primary 17DD-YF vaccination of Autoimmune Disease patients categorized according to the PRNT status after primary 17DD-YF vaccination: AID/PRNT(−) (n = 32, D3–4 = light grey filled inverted triangle, D5–6 = grey filled inverted triangle, D7 = dark grey filled inverted triangle and D14–28 = black filled inverted triangle) and AID/PRNT(+) (n = 108, D3–4 = light grey filled triangle, D5–6 = grey filled triangle, D7 = dark grey filled triangle and D14–28 = black filled triangle). The results are expressed as the proportion of subjects with increased biomarker levels (baseline fold change values > 1). The results are expressed as the proportion of subjects with increased biomarker levels (baseline fold change values > 1). Data analysis was carried out considering the 50th percentile as the reference to identify the set of biomarkers with high proportion of subjects with levels above the global median cut-off along the kinetic timeline. Those biomarkers with proportion of subjects with levels above the global median cut-off were highlighted with gray scale rectangles. (B) Heatmaps were assembled for subgroups of Autoimmune Disease patients considering the PRNT status after vaccination [AID/PRNT(−), n = 32; AID/PRNT(+), n = 108] and according to the type of autoimmune disease [Rheumatoid Arthritis (RA, n = 38), Spondyloarthritis (SpA, n = 51), Systemic Lupus Erythematosus (SLE, n = 21) and Sjögren’s Syndrome (SS, n = 30)]. Data interpretation was carried out based on the color keys employed to underscore the baseline fold value = 1.0 as the reference for unaltered levels (black filled square), the baseline fold value < 1.0 for decreased levels (green filled square) and the baseline fold value > 1.0 for increased levels (red filled square), according to the paired sample collected at D0.

