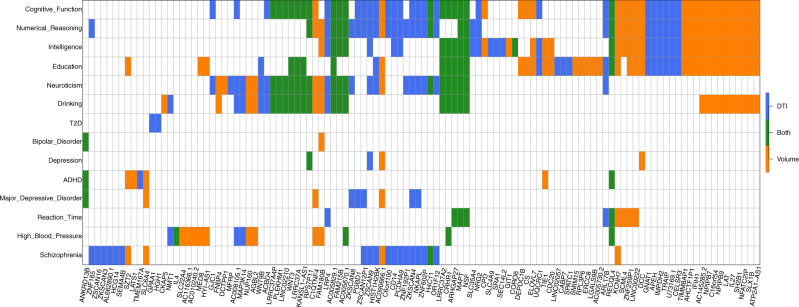
Fig. 3. Overlapping cross-tissue TWAS-significant genes between neuroimaging traits (n = 19,629 subjects for ROI volumes and 17,706 for DTI parameters) and other complex traits and clinical outcomes.
The gene-level associations were estimated and tested by the cross-tissue UTMOST approach (https://github.com/Joker-Jerome/UTMOST). We adjusted for testing 211 neuroimaging traits (p value threshold 1.04 × 10⁻⁸) and 16 other traits (p value threshold 1.37 × 10⁻⁷) with the Bonferroni correction, respectively. The x axis provides the IDs of the neuroimaging traits. The y axis lists the 16 other traits, and Supplementary Data 15 details the resources of their GWAS summary statistics and the sample sizes of corresponding studies.

