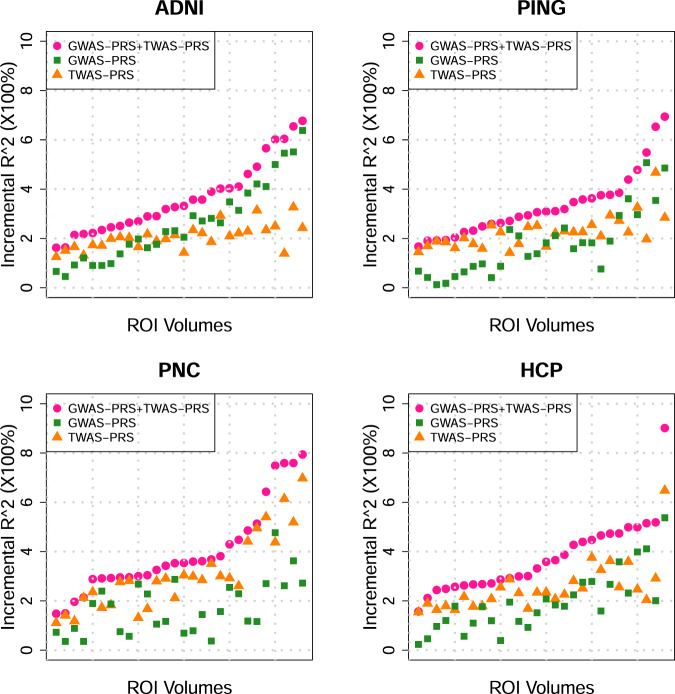
Fig. 5. Prediction accuracy (incremental R2) of gene-based polygenic risk scores constructed by UKB-derived TWAS summary statistics (TWAS PRS), variant-based PRS constructed by UKB-derived GWAS summary statistics (GWAS PRS), and both of them (GWAS PRS + TWAS PRS) on the four independent data sets (n = 19,629 subjects).
The x axis lists 28 ROI volumes whose TWAS PRS are significant in all the four data sets after the Bonferroni correction and the y axis lists the proportions of phenotypic variation that can be additionally explained by PRS.

