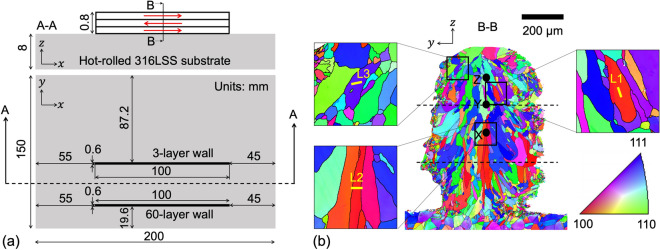
Figure 1.
Design and crystallographic orientation map of the LMD 316LSS walls from which TEM lamellae are extracted. (a) An illustration (not-to-scale) of the single-track bidirectionally-printed 3-layer and 60-layer LMD 316LSS walls on a hot-rolled 316LSS substrate. Directions , and respectively represent the printing, thickness and building directions. The top view and the front view of a cross-section A–A are shown. The red arrows in the front-view show the direction of printing of each layer. (b) An EBSD orientation map color-coded according to IPF along building direction at a cross-section B–B approximately at the mid-section of the 3-layer wall. Dotted lines in (b) represent the approximate position of interlayer boundaries. The black solid circles in (b) indicate the points X, Y and Z that correspond to the locations in the FE simulations from where the temperature vs time data has been extracted and plotted in Fig. 7. Subfigures in (b) show zoomed-in EBSD maps. Yellow-colored lines demark zones underneath which lamellae L1, L2 and L3 are extracted (in the out-of-plane direction). These lines correspond to the top side of L1, L2 and L3 in the HAADF images in Fig. 2. Aztec v4.2 (Oxford Instruments https://nano.oxinst.com/products/aztec/) and Microsoft PowerPoint have been used to prepare this figure.

