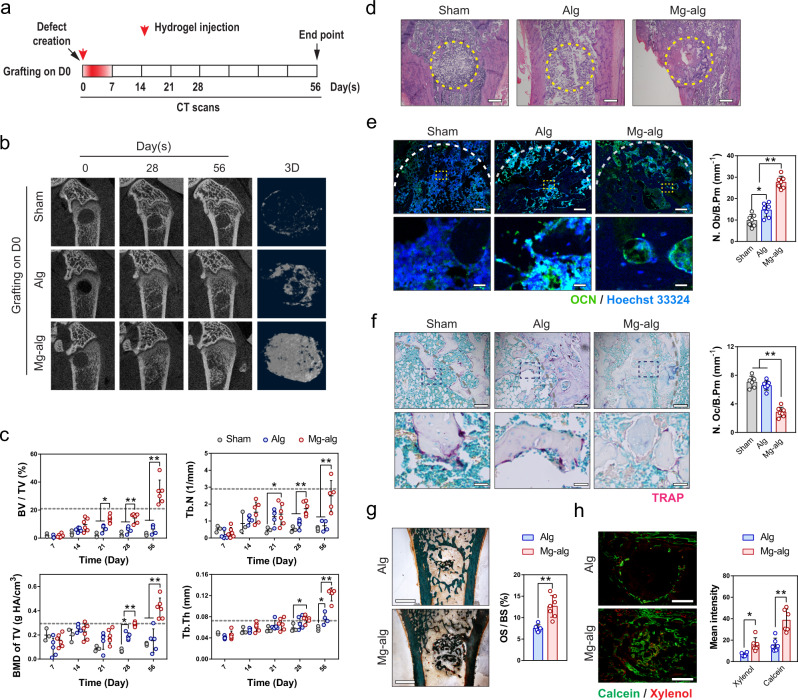
Fig. 1. Mg2+ releasing alginate promoted bone healing of defects in the rat femur.
a Mg2+-crosslinked alginate was injected into the femur defect in rats right after the injury, hence the release of Mg2+ was limited to the first week of the injury. b Representative micro-CT images and reconstructed 3D images of the defects in rat femora without grafting (Sham, n = 3), grafted with pure alginate (Alg, n = 5) or Mg2+ releasing alginate (Mg-Alg, n = 6). c Corresponding measurements of trabecular bone fraction (BV/TV), trabecular number (Tb.N), bone mineral density (BMD of TV), and trabecular thickness (Tb.Th) showing the healing process of rat femoral defects. Sham, n = 3; Alg, n = 5; Mg-alg, n = 6. The dashed line shows the mean value of each bone parameter at the defect area before the operation. d Representative H&E staining images of the grafted defects in the rat femora, scale bars = 500 µm. e Representative immunofluorescent images and quantification showing the presence of osteoblasts (N.Ob/B.Pm, n = 6) in the grafted defects in the rat femora on day 56. Lower images (scale bars = 50 µm) are high-resolution versions of the boxed regions in the upper images (scale bars = 500 µm). f Representative TRAP staining images showing the presence of osteoclasts in the grafted defects in the rat femora, and histomorphological analysis of osteoclast numbers (N.Oc/B.Pm, n = 6) in the defects of femora on day 56. Lower images (scale bars = 40 µm) are high-resolution versions of the boxed regions in the upper images (scale bars = 200 µm). g Representative Goldner’s trichrome staining of the grafted defects on day 56, scale bars = 1 mm, and quantitative analysis of osteoid surface per bone surface (OS/BS, n = 6) in the grafted femoral defects. h Representative images of calcein/xylenol labeling for bone regeneration in the rat femoral defects grafted with alginate or Mg2+ releasing alginate, scale bars = 1 mm, and quantitative analysis of fluorescence intensity of calcein/xylenol (n = 6). Data are mean ± s.d. n.s. P > 0.05, *P < 0.05, **P < 0.01 by two-way ANOVA with Tukey’s post hoc test (c), one-way ANOVA with Tukey’s post hoc test (e, f), or Student’s T-test (g, h).

