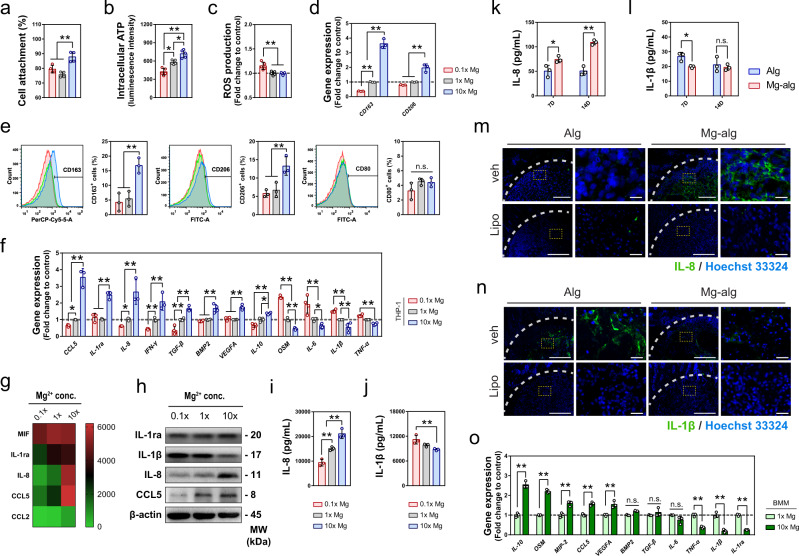
Fig. 4. Mg2+ regulated the inflammatory microenvironment through the immunomodulation of macrophages.
a, b, c The effects of different concentrations of Mg2+ on the cell attachment (a, n = 4), intracellular ATP level (b, n = 5), and ROS production (c, n = 4) of macrophages differentiated from suspension THP1 monocytes. The data for cell attachment was expressed as a percentage of initially seeded THP-1 cells. d The effect of different concentrations of Mg2+ on the gene expression of CD163 and CD206 in THP1-derived macrophages as evaluated by RT-qPCR (n = 3). e The effect of different concentrations of Mg2+ on the polarization of macrophages was evaluated by the expression of CD163, CD206, and CD80 using flow cytometry (n = 3). f The relative expression of inflammatory-related genes regulated by the stimulation of Mg2+ in THP1-derived macrophages (n = 3). g Major cytokines that respond to the stimulation of Mg2+ determined by cytokine arrays were shown in a heat map. h Representative western blots showing the expression of IL-1ra, IL-1β, IL-8, and CCL5 of THP1-derived macrophages cultured in a medium supplemented with different concentrations of Mg2+. i, j ELISA analysis showing the concentration-dependent effect of Mg2+ on the production of IL-8 (i) and IL-1β (j) in THP1-derived macrophages (n = 3). k, l ELISA analysis on IL-8 (k) and IL-1β (l) in the grafted defects in the rat femora on day 7 after the operation (n = 3). m, n Representative immunofluorescent images showing the expression of IL-8 (m) and IL-1β (n) on day 7 in the grafted defects in the rat femora, (n = 3), right images (scale bars = 20 µm) are high-resolution versions of the boxed regions in the left images (scale bars = 200 µm). o The inflammatory-related genes regulated by the stimulation of Mg2+ in mouse primary bone marrow macrophages (BMM, n = 3). Data are mean ± s.d. n.s. P > 0.05, *P < 0.05, **P < 0.01 by one-way ANOVA with Tukey’s post hoc test (a–e, i, j) or two-way ANOVA with Tukey’s post hoc test (f, k, l, o).

