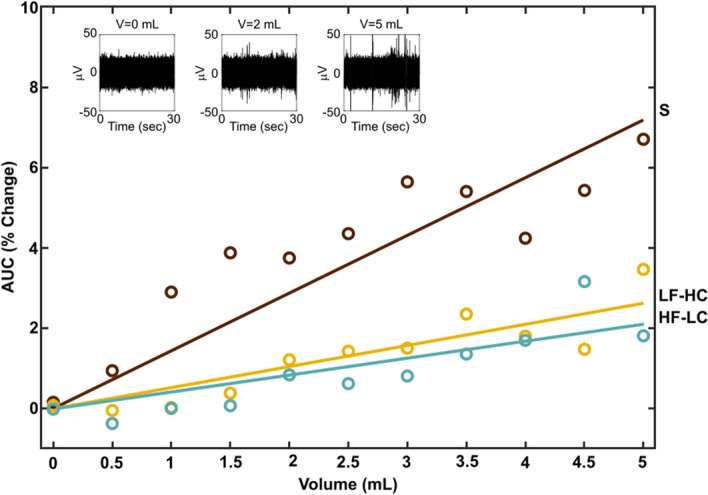
Figure 3.

The change observed in the mean area under the curve (AUC) within vagal nerve recordings as a function of stomach volume across trials and MEA channels. Diet types are standard (S), low fat high carbohydrate (LF-HC), and high fat low carbohydrate (HF-LC). Circles indicate means across animals, time samples, and MEA channels for each injected volume binned in 0.5 mL increments. Linear regression R2 values: 0.70, 0.80, and 0.73 for the standard, LF-HC, and HF-LC diets, respectively. The insets show 30 s of raw ENG at three different volumes from one MEA channel of one trial in an animal fed the standard diet.
